I’m sometimes asked for a tool to compare the similarity of a list of molecules with every other molecule in the list. I suspect there may be commercial tools to do this but for small numbers of compounds it is easy to visualise in a Jupyter notebook using RDKit. This is an old notebook that I’ve just updated to reflect the latest versions of RDKit and Pandas.
The RDKit has a variety of built-in functionality for generating molecular fingerprints and using them to calculate molecular similarity. Morgan fingerprints, better known as circular fingerprints, are built by applying the Morgan algorithm to a set of user-supplied atom invariants. The generated fingerprints are then compared using Dice similarity metric.
The input data file format is tab separated text, in this example I’ve taken 100 random molecules from ChEMBL.
|
1 2 3 |
SMILES ID CC(NC(=O)N(C)O)c1cc2ccccc2s1 CHEMBL61706 Cc1nc(c(c(n1)-c1ccc(cc1)F)CCC1C[C@@H](O)CC(=O)O1)C CHEMBL158323 |
The first few cells of the notebook simply import the required libraries and the input file into a pandas dataframe.
|
1 2 3 4 5 6 7 8 9 10 11 12 13 |
from rdkit.Chem import AllChem as Chem from rdkit.Chem.Draw import IPythonConsole from rdkit.Chem import PandasTools from rdkit.Chem import Draw from rdkit import DataStructs import numpy import seaborn as sns import matplotlib import pandas as pd #Allow inline images %matplotlib inline |
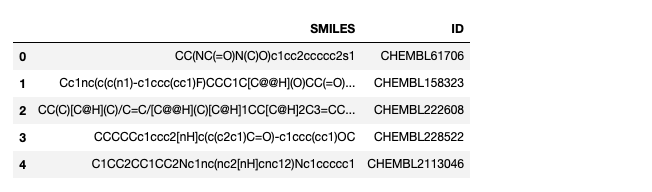
Next we read in the file and display the first five rows
|
1 2 3 4 5 6 7 8 9 10 11 12 |
#If you want to read a local file then simply edit this filepath #datafile = pd.read_csv('myfile.tsv', sep = '\t') #The file format is tab separated text #SMILES ID Name #This example uses 100 random structures from ChEMBL datafile = pd.read_csv('fortest.tsv', sep = '\t') #View first five rows datafile.head(5) |
Convert the SMILES string to an RDKit molecular object
We can see the different datatypes in the dataframe
datafile.dtypes
SMILES    object
ID        object
dtype: object
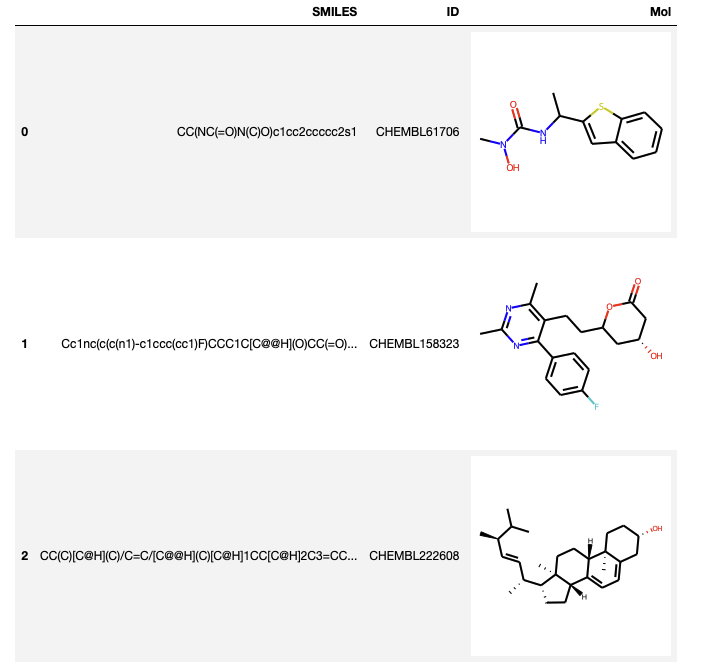
At the moment the molecule structures are represented by a SMILES string, we can convert the SMILES string to an RDKit molecular object and then display
|
1 2 3 4 |
PandasTools.AddMoleculeColumnToFrame(datafile,'SMILES','Mol',includeFingerprints=True) >>> print([str(x) for x in datafile.columns]) datafile.head(3) |
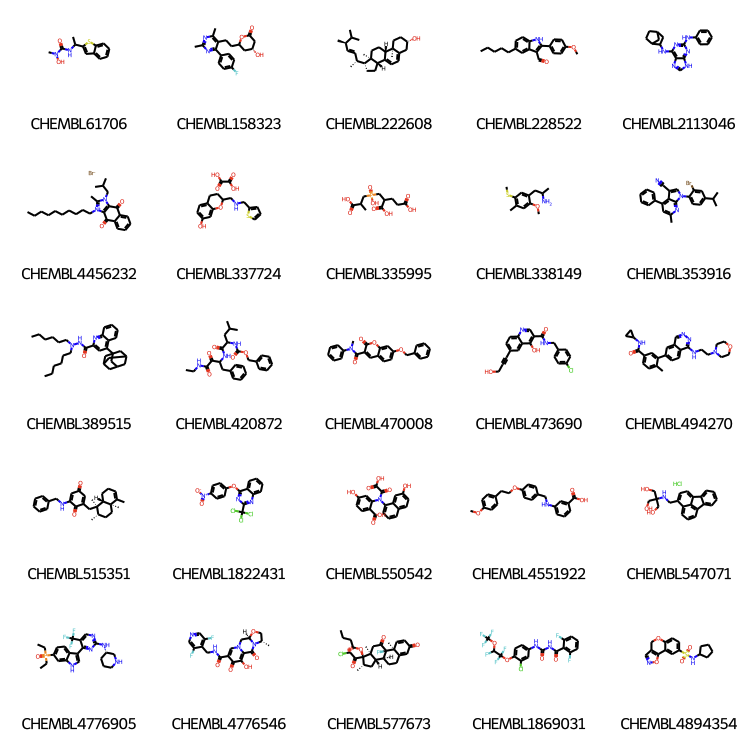
If we want to view all structures we can diaplay them as a grid
|
1 |
PandasTools.FrameToGridImage(datafile,column= 'Mol', molsPerRow=5,subImgSize=(150,150),legendsCol="ID") |
Calculation of molecular similarities
Now calculate fingerprints using RDKit, adding them to the end of the dataframe.
|
1 2 3 4 5 6 |
fplist = [] #fplist for mol in datafile['Mol']: fp = Chem.GetMorganFingerprintAsBitVect( mol,2 ) fplist.append(fp) datafile['mfp2']=fplist |
Comparing the similarity of two molecules
|
1 2 3 4 5 |
fp1=datafile.at[0,'mfp2'] fp2=datafile.at[1,'mfp2'] from rdkit import DataStructs DataStructs.DiceSimilarity(fp1,fp2) |
0.1686746987951807
We can now do this for molecules in the data set
|
1 2 3 4 5 6 7 8 9 10 11 |
for r in datafile.index: #r =0 fp1 = datafile.at[r,'mfp2'] colname = datafile.at[r,'ID'] simlist = [] #fplist for mol in datafile['Mol']: fp = Chem.GetMorganFingerprintAsBitVect( mol,2 ) sim =DataStructs.DiceSimilarity(fp1,fp) sim = round(sim,2) #only need value to 2 decimal places simlist.append(sim) datafile[colname]=simlist |
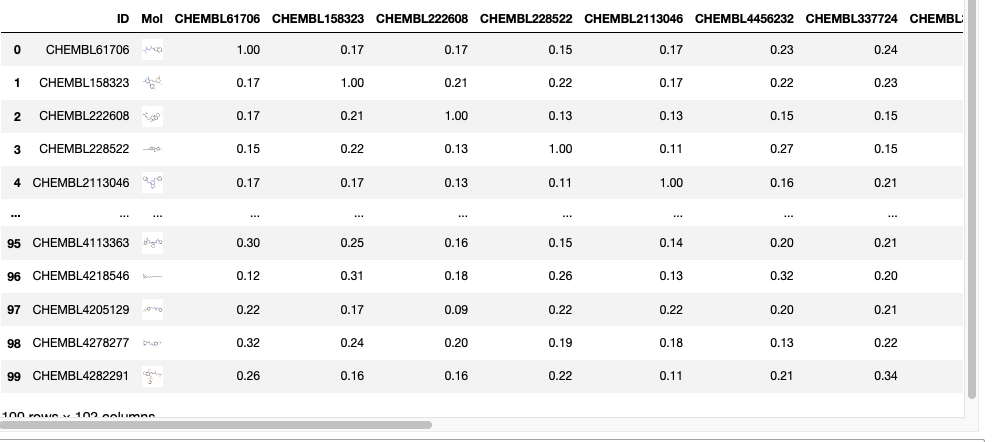
We now have all the similarity measures in the dataframe so we can remove any columns not needed.
|
1 2 3 4 |
#difficult to view dataframe so remove fingerprint column and others newdatafile = datafile.drop(['mfp2','SMILES'], axis=1) newdatafile |
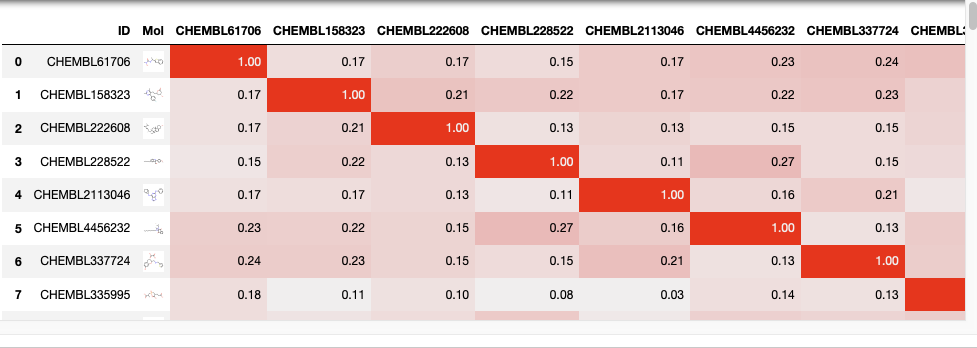
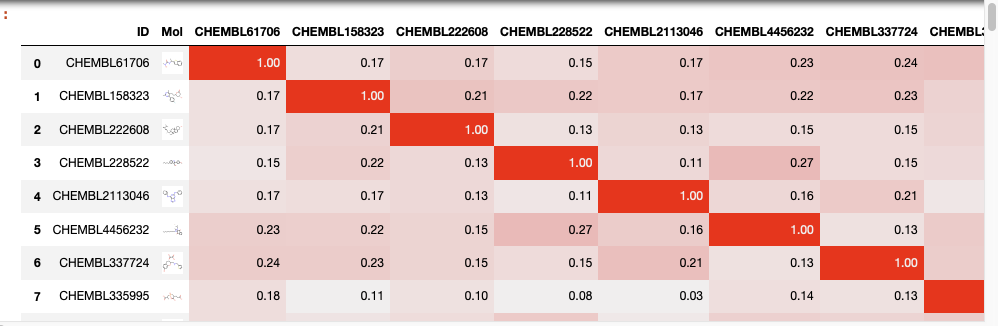
Contextual colouring of dataframe
We can also use contextual colouring on the dataframe, in this instance we are going to highlight similarity scores but it could be used to highlight affinity, IC50 or a calclated property like LogP.
You can create “heatmaps” with the background_gradient method. These require matplotlib, and here we use Seaborn to get a nice colormap.
|
1 2 3 4 5 |
import seaborn as sns cm = sns.light_palette("red", as_cmap=True) s = newdatafile.style.background_gradient(cmap=cm).format(precision=2) s |
You can download the notebook and the data file here.