tmap is a very fast visualisation library for large, high-dimensional data sets. It was published in 2020 DOI and the code is available on GitHub (https://github.com/reymond-group/tmap). In theory it should be possible to install using conda but it seems the arm-64 format binaries for osx are not being generated (https://github.com/reymond-group/tmap/issues/55). Fortunately, it is possible to locally build the binary for Apple Silicon.
Detailed instructions and a shell script are available here https://gist.github.com/mjwen/0548a685412881f8802afcb31552b9f1
I’ve reproduced the script below and can confirm it all works fine on my MacBook Pro M1 Max. You do need to have conda installed (https://conda.io/projects/conda/en/latest/user-guide/install/macos.html).
|
1 2 3 4 5 6 7 8 9 10 11 12 13 14 15 16 17 18 19 20 21 22 23 24 25 26 27 28 29 30 31 32 33 34 35 36 37 38 39 40 41 42 43 44 45 46 47 48 49 50 51 52 53 54 |
#!/usr/bin/env bash # This script builds and installs TMAP (https://github.com/reymond-group/tmap). # Particully, this aims at ARM macOS, for which no official binary is provided. # Requires: # Conda is needed to obtain the prerequisites: cmake and openmp. # To install: # Place this script in a directory where you want to store the TMAP repo, then # $ bash install_tmap.sh # To use: # This script installs tmap in a conda environment named `tmap-env`. # After installing, activate this conda environment to use it. # Achieved via the below steps: # 0. clone the repo # 1. creating an conda env named `tmap-env` # 2. get `cmake` and `libomp` using conda # 3. compile OGDF, which is shipped with tmap # 4. export LIBOGDF_INSTALL_PATH # 5. install tmap # 0 GIT_REPO=https://github.com/reymond-group/tmap.git git clone ${GIT_REPO} # 1 and 2 source ${CONDA_PREFIX}/etc/profile.d/conda.sh # make sure conda activate works in a bash script conda env remove --name tmap-env # remove env if it exists conda create --name tmap-env -y conda activate tmap-env conda install -c conda-forge pip cmake llvm-openmp -y # 3 cd tmap pushd ogdf-conda/src/ mkdir build mkdir installed cd build cmake ../ -DCMAKE_INSTALL_PREFIX=../installed make -j 10 make install popd # 4 export LIBOGDF_INSTALL_PATH=$(pwd)/ogdf-conda/src/installed # 5 # -I${CONDA_PREFIX}/include to use omp.h CXXFLAGS=-I${CONDA_PREFIX}/include pip install -e . |
Put the install_tmap.sh script in the folder you want to install TMAP then type
|
1 |
bash install_tmap.sh |
Once completed you can check that the env has been created by typing
|
1 2 3 4 5 6 7 8 |
(base) ChrisM1MBP ~ % conda env list # conda environments: # base * /Users/chrisswain/miniconda3 chemprop /Users/chrisswain/miniconda3/envs/chemprop memfast /Users/chrisswain/miniconda3/envs/memfast myRDKitenv /Users/chrisswain/miniconda3/envs/myRDKitenv tmap-env /Users/chrisswain/miniconda3/envs/tmap-env |
Activate the conda environment by typing.
|
1 2 |
conda activate tmap-env (tmap-env) chrisswain@ChrisM1MBP ~ % |
I also installed RDKIt, faerun and matplotlib for plotting.
|
1 2 3 |
conda install -c conda-forge rdkit pip install faerun pip install matplotlib |
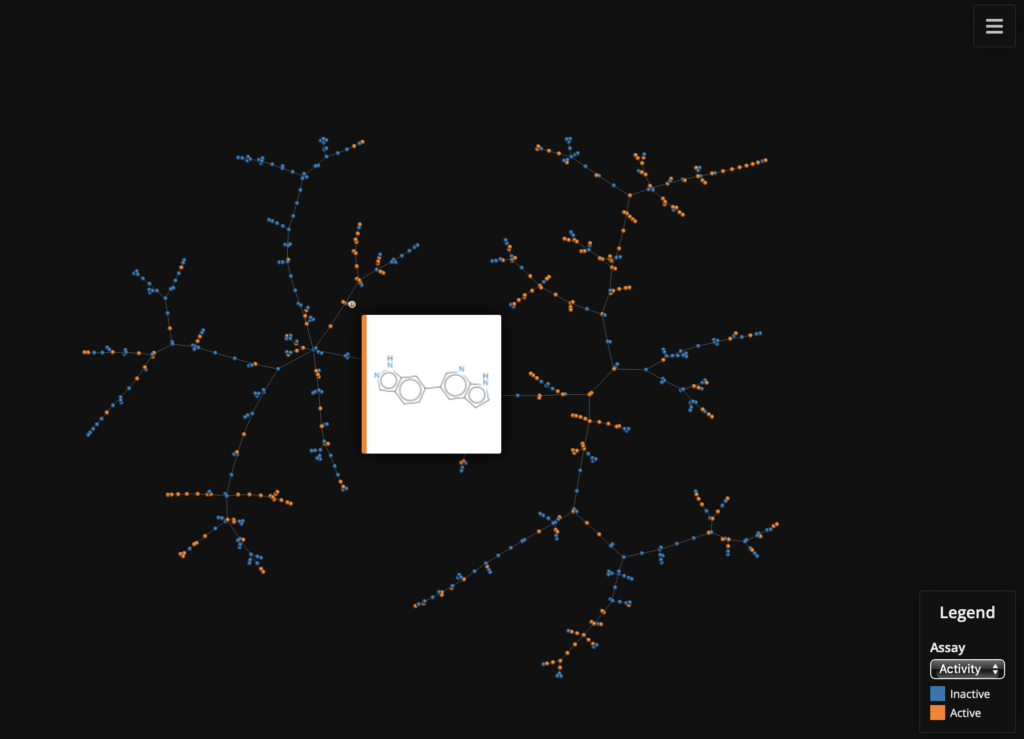
I tested the installation with one of the examples on the tmap GitHub page.
|
1 2 3 4 |
import pandas as pd import tmap as tm from mhfp.encoder import MHFPEncoder from faerun import Faerun |
|
1 2 3 4 5 |
# Loading data from: # PUBCHEM_BIOASSAY: Navigating the Kinome. # (https://www.ebi.ac.uk/chembl/assay_report_card/CHEMBL1963834/) # File is provided on GitHub in examples df = pd.read_csv("CHEMBL25-chembl_activity-X98QJiCI4eAUAQSKQevT44ZjymoCjs8alCsnJir8aUU=.csv.gz", sep=";") |
|
1 2 3 4 5 6 7 8 9 10 11 12 13 14 15 16 17 18 19 20 21 22 23 24 25 26 27 28 29 30 31 32 33 34 35 36 37 38 39 40 41 42 43 44 |
# The number of permutations used by the MinHashing algorithm perm = 512 # Initializing the MHFP encoder with 512 permutations enc = MHFPEncoder(perm) # Initialize the LSH Forest lf = tm.LSHForest(perm) # Create MHFP fingerprints from SMILES # The fingerprint vectors have to be of the tm.VectorUint data type fingerprints = [tm.VectorUint(enc.encode(s)) for s in df["Smiles"]] # Add the Fingerprints to the LSH Forest and index lf.batch_add(fingerprints) lf.index() # Get the coordinates x, y, s, t, _ = tm.layout_from_lsh_forest(lf) # Let's color by active / inactive, which is set in the "Comments" field # of the dataframe active = [1 if a == "active" else 0 for a in df["Comment"]] # Create the labels for SMILES with ID df["SmilesID"] = df["Smiles"] + '__' + df["Molecule ChEMBL ID"] # Now plot the data faerun = Faerun(view="front", coords=False) faerun.add_scatter( "Assay", {"x": x, "y": y, "c": [active, df["AlogP"]], "labels": df["SmilesID"]}, point_scale=5, colormap=["tab10", "viridis"], has_legend=True, categorical=[True, False], legend_labels=[(0, "Inactive"), (1, "Active")], series_title=["Activity", "ALogP"], ondblclick="window.open(`https://www.ebi.ac.uk/chembl/compound_report_card/${labels[1]}/`, '_blank');" ) faerun.add_tree("Assay_tree", {"from": s, "to": t}, point_helper="Assay") # Choose the "smiles" template to display structure on hover faerun.plot(template="smiles", notebook_height=750) |

Using MayaChem Tools
MayaChemTools is a growing collection of Perl and Python scripts, modules, and classes to support a variety of day-to-day computational discovery needs. It includes a set of command line Python scripts based on RDKit provide functionality for a variety of tasks, including a command line Python script based on TMAP that provides functionality to visualize chemspaces.
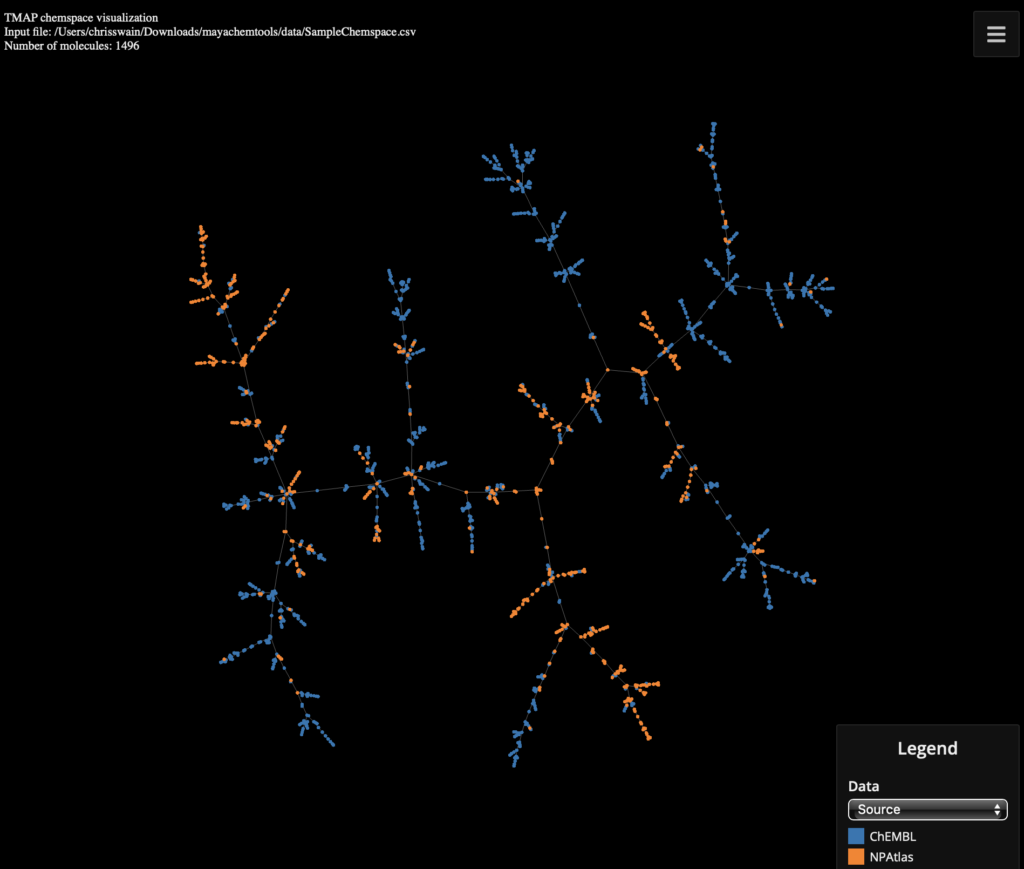
Using the provided example file SampleChemspace.csv from the MayaChemTools download.
The command to use the script is shown below.
|
1 |
python VisualizeChemspaceUsingTMAP.py --categoricalDataCols Source -i mayachemtools/data/SampleChemspace.csv -o SampleChemspace.html |

You can view the interactive page here :-
https://macinchem.org/wp-content/uploads/2024/04/SampleChemspace.html