ChemAxon are a software company that produce a variety of cheminformatics applications and software development modules. A key driver for development has been maintaining portability among various operating systems and a focus on web-based integration thus they have made extensive use of Java. Many of the tools are free to academics or for evaluation and they have a reputation for being very active partners in collaborations. In my last review I described Marvin which is the chemical structure viewer/editor, in this review I’m going to focus on Instant JChem which is an easy to create chemical database which provides a means to store, search and view chemical structures and any associated data. These can either be local databases which I will focus on, or remote databases held on a server.
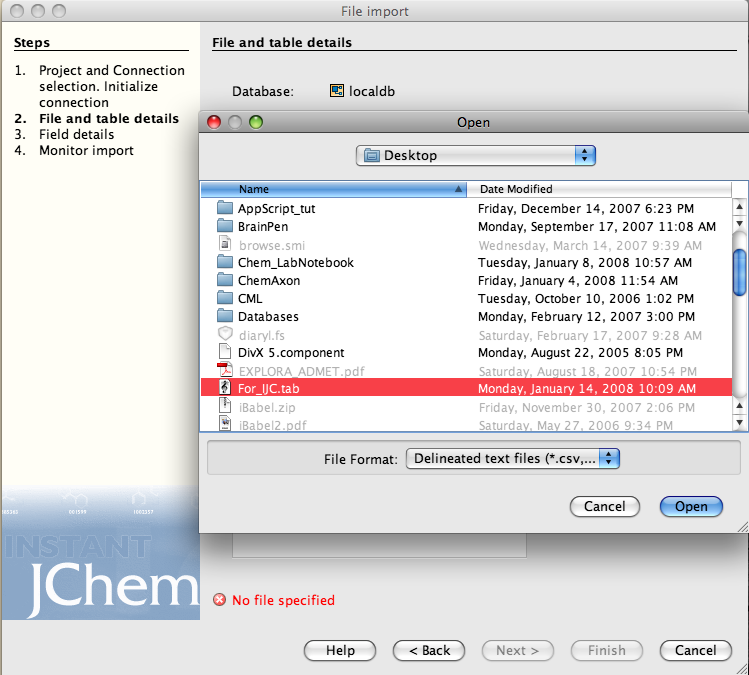
Perhaps the easiest way to review this sort of application is to describe it’s use. Instant JChem (IJC) can be downloaded from the ChemAxon website and uses a standard MacOSX installer. Once installed double click on the IJC icon in the ChemAxon folder to start the application. You first need to create a “New Project” (File Menu), I called this “HERG Database” since in my day job I’m compiling a database of publically available data on compounds that bind to this ion channel, if you like to read more about have a look at this page. We can now import the data, the data can be in a variety of formats these include SMILES, InChi, sdf, marvin, and deliminated text. (If you want to try this for yourself I’ve put a subset of the dataset here).
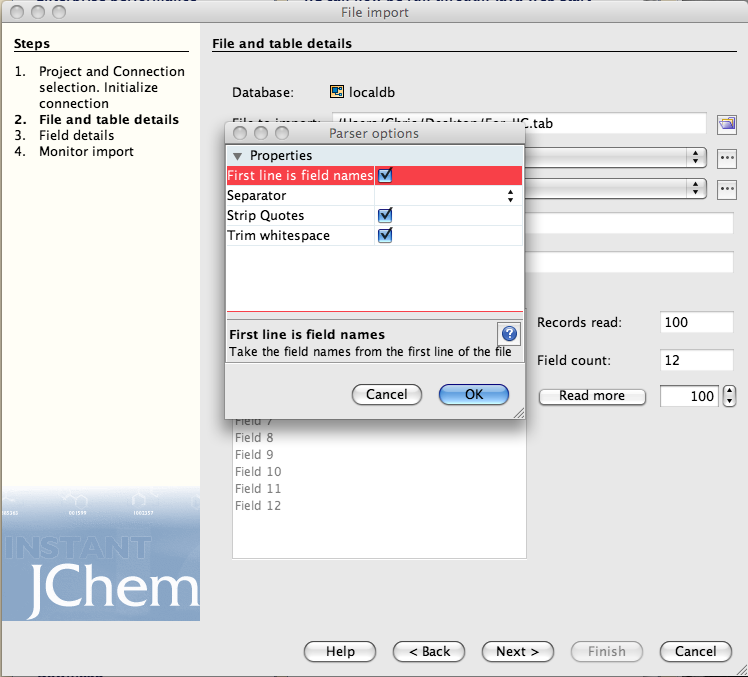
You may need to check the parser options, I had the field names as the first line in the import text file.
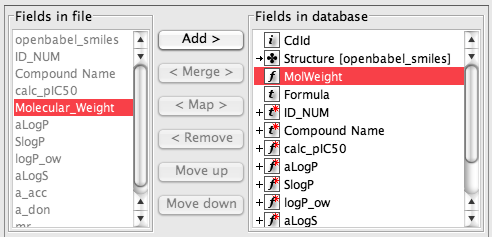
Click on the next button and then you need to check the field mapping, the right hand list details all the fields that are in or will be created in the new data table. The entry “openbabel_smiles” can be removed from the right hand list because this represents the chemical structure. Now highlight “openbabel_smiles” in the left hand list and “Structure” in the right hand and click “map”. On import the SMILES will be converted to a structure and displayed in the Structure field.
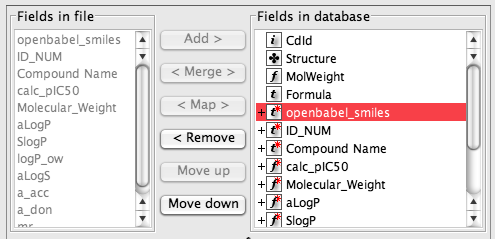
Some like “Molecular_Weight” can be removed from the right hand list because they will be automatically calculated.
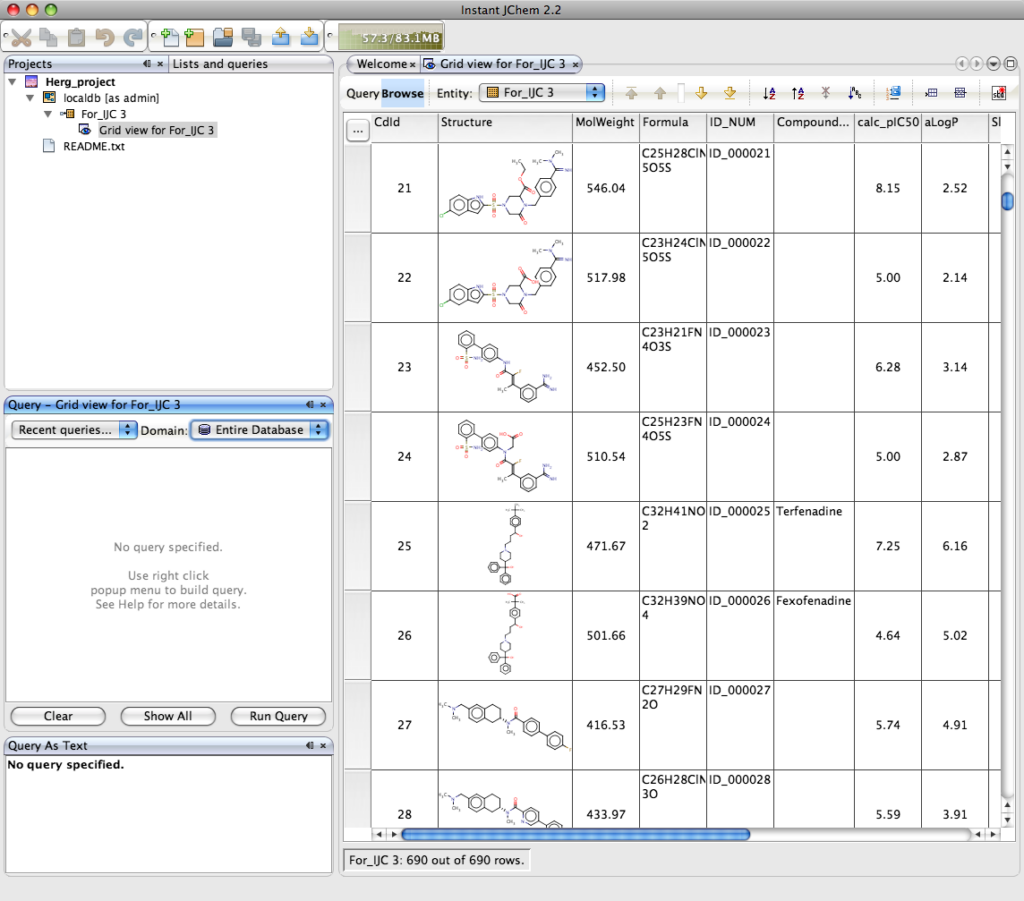
The result is shown below, this is a grid view of the imported data, the columns can be sorted ascending or descending by simply selecting the column and either right clicking and selecting from the dropdown menu or selecting the icon on the tool bar. In a similar way to Marvin a variety of property calculations can be undertaken by means of a series of plugins. These include Elemental Analysis, IUPAC Naming Plugin, pKa Plugin, Major Microspecies Plugin, Isoelectric Point Plugin, Partitioning, logP Plugin, logD Plugin, Charge Plugin, Polarizability Plugin, Orbital Electronegativity Plugin, Tautomerization Plugin, Resonance Plugin, Stereoisomer Plugin, Conformer Plugin, Molecular Dynamics Plugin, Topology Analysis Plugin, Geometry Plugin, Polar Surface Area Plugin (2D), Molecular Surface Area Plugin (3D), Hydrogen Bond Donor-Acceptor Plugin, Huckel Analysis Plugin, Refractivity Plugin.
Of course the real power of IJC is the ability to search the dataset, right click in the Query pane and you can add the fields you want to query, if you choose the Structure field a Marvin box is automatically added to allow you draw the query structure. IJC supports substructure, similarity, superstructure, exact searching of structure fields, in addition to the usual options of the other fields depending on whether they are numeric or text fields. You can be complex queries using a combination of AND or OR. Clicking “Run Query” executes the search, on this dataset of 700 compounds the search takes a screen refresh to complete, but I tried similar searchs on files containing 70,000 structures and the search was still completed in a screen refresh on a Dual G5(2.5GHz) with 1GB of RAM!
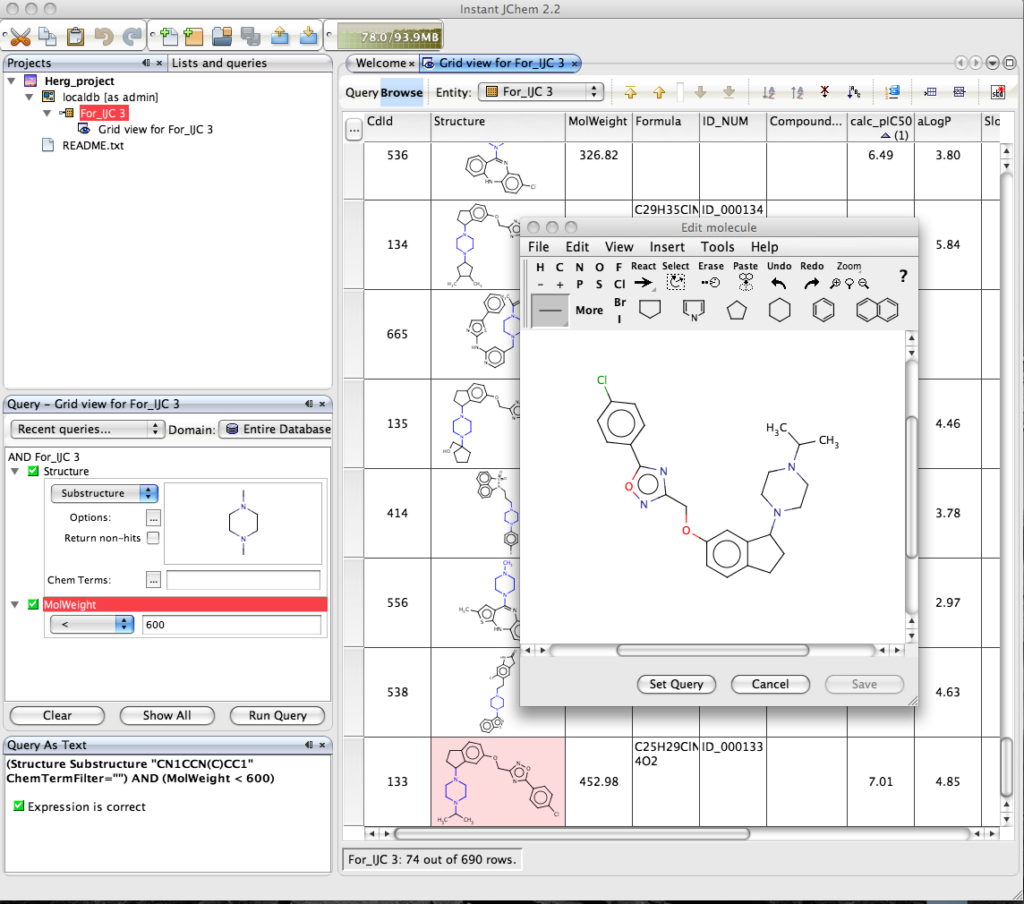
The results are displayed in the main window, with the relevant component from the structure query highlighted. Double clicking on the structure opens the Marvin structure editor. One nice feature is the option to set the structure in the display to the query.
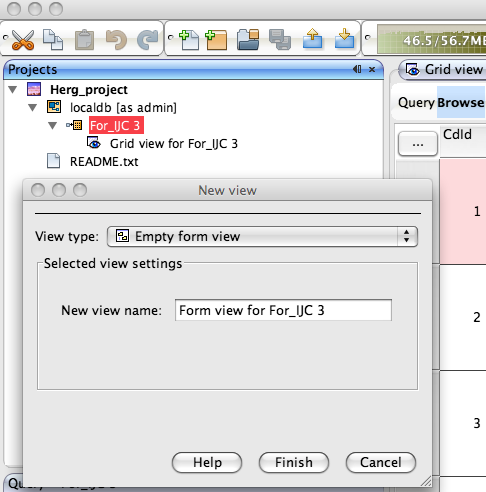
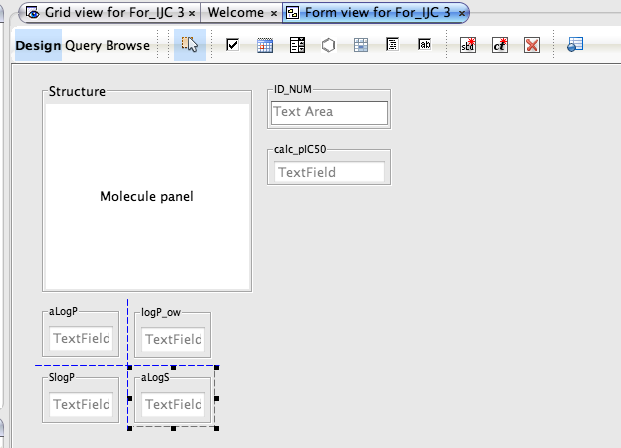
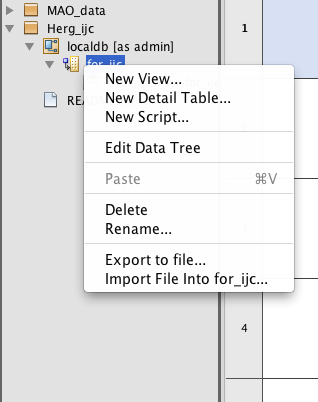
Whilst the automatically generated grid view is a good way to browse through data it is not always the best use of screen real estate and sometimes a form based view allows you to bring together key data fields. To generate a new form view right click on the data set in the tree view in the Project pane and select “New View” in the dialog box set the view type to “Empty form view”, this creates a blank form in the main pane.
You can now drag and drop widgets from the tool bar, you can switch between Design and Browse views to see how the form looks and to check you have the correct data displayed. As you drag boxes around guidelines appaer to help alignment and double clicking on a field allows you to edit the properties. You can also add chemical calculations such as atom count, number of H-bond donors/acceptors, but note these will have to be calculated for all structures which might take a few minutes for large number of molecules. Forms also allow you display relational data. An example might be where you have the average IC50 in the main table, but all the individual datapoints in a related table. You can use a form to display all the individual points in a table view on the form.
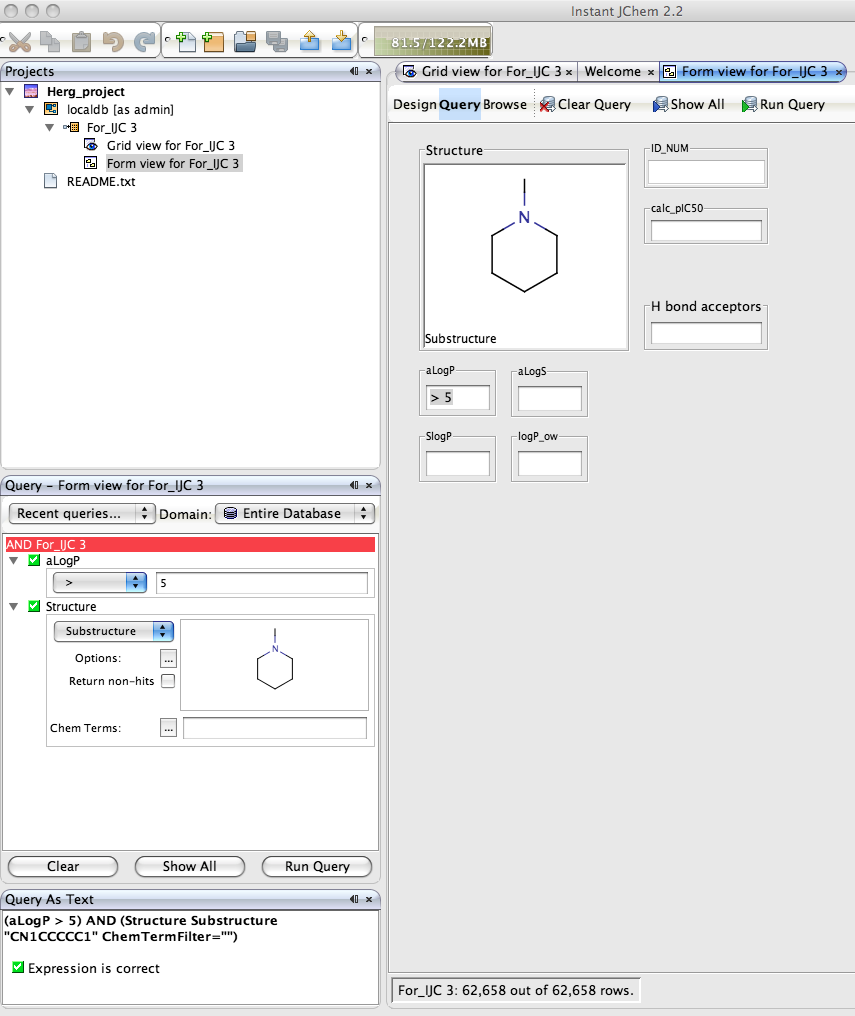
The form can also be used to define the query, simply click the Query button and enter the query into the data fields or double click on the structure field to open the Marvin structure editor. One really nice feature is the query automatically displays in the Query panel and the Query As Text panel. Once you have run the query you can view the results in the form or switch to the Grid view the same results are available in both.
The form can also be used to define the query, simply click the Query button and enter the query into the data fields or double click on the structure field to open the Marvin structure editor. One really nice feature is the query automatically displays in the Query panel and the Query As Text panel. Once you have run the query you can view the results in the form or switch to the Grid view the same results are available in both.
After running a query you can save the result as a list, you can use these lists to further refine your search from logical combinations of other lists (Intersection, Union, XOR, A and not B, B and not A). In a similar way queries can be saved and rerun at a later date or shared with colleagues, for example a query for “This weeks results” would be useful for everyone.
There are very few options for searchable chemical databases under MacOSX, Chemical Computing Groupprovide chemical structure-based searching as part of MOE a comprehensive computational chemistry and molecular modelling package. Other vendors such as Daylight support Mac OS X with there informatics toolkit but it is really intended for enterprise level support. It is also possible to use the OpenBabel toolkit to build chemical databases under MacOSX. However Instant JChem provides the best solution for the bench chemist by far, what is particularly of note is the fact that Instant JChem Personal is free! From the ChemAxon website “Instant JChem Personal includes all search, viewing and structure import/export, forms and relational data capabilities as standard but to access external database engines, share local database tables, define custom structure canonicalization and batch process structure based calculations, will require ‘pay for’ licenses”. There are a few minor quibles, in some of the dialog boxes or buttons the text is not displayed correctly, particularly when resizing, and sometimes the scroll bars don’t display correctly, but these are only minor cosmetic issues. In the form design it might be useful to be able to “group” fields so they can be moved around together. ChemAxon also have also created a selection of animations that illustrate many of the capabilities of IJC.
In summary, Instant JChem is the best personal chemical database available for MacOSX, in the two years since the initial release the feature set has been enhanced at a remarkable rate and the performance is now outstanding. An alternative is the Java Web Start version, this is an easier way to get started, have a look here Web Start
Updated Instant JChem and Plots
I wrote a review of Instant JChem from ChemAxon a little while ago and since then there have been regular updates. One feature that has been added is the ability to add plots on forms and so I thought I’d review this feature.
For those not familiar with Instant JChem
Instant JChem is a desktop application for end user scientists. With Instant JChem you can create, explore and share chemical and non chemical data in local and remote databases without additional administration. Instant JChem has a wide and growing range of functionality including customizable database views, integration of library enumeration and dynamic population of columns with singular and combined molecular property and descriptor predictions.
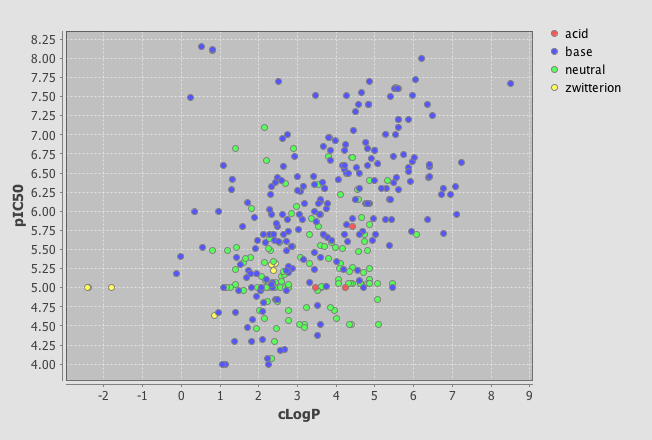
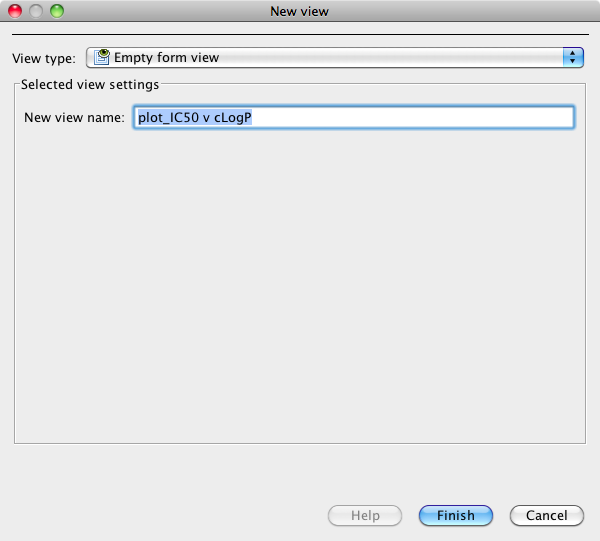
In the latest version there is now a Instant JChem Visualizer Add-on that allows you to add a number of plot types to forms. To do this simply right click on the tree menu of data sources and select “New View”, set the view type to “Empty form view” and give it a title. I’m using a dataset of HERG ligands for which I have the experimental pIC50, the calculated LogP and I’ve used the calculated pKa to categorise the molecules into acidic, basic, neutral or zwitterion
Select the “Design” tab and then click the plots icon.
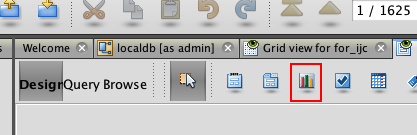
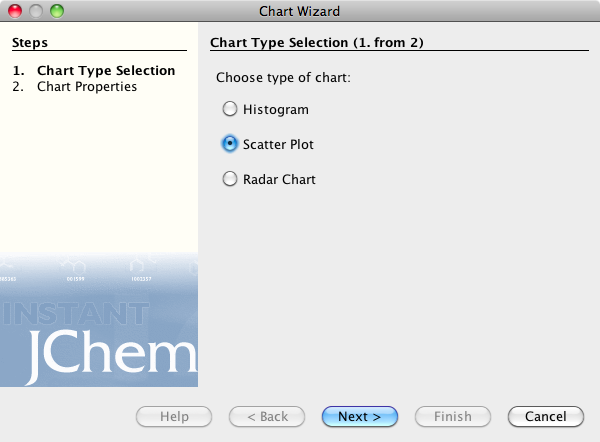
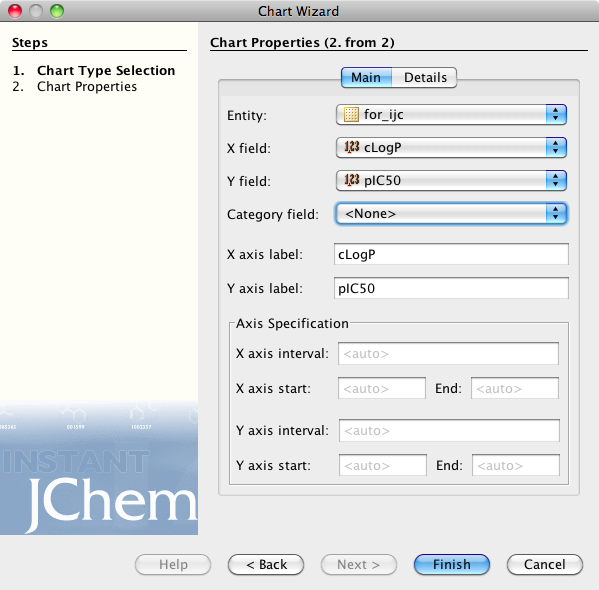
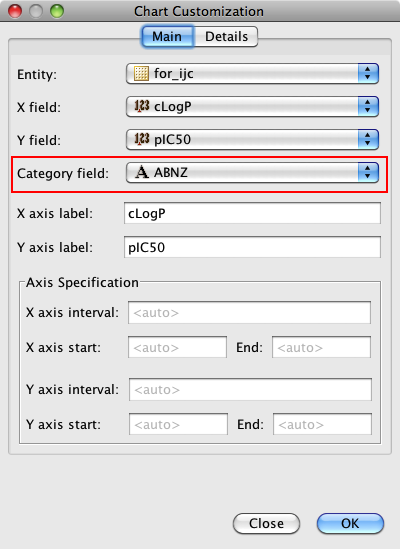
Currently Instant JChem can display 3 plot types, histograms, scatter plots and radar plots, for this display I chose the scatter plot option, this opens the Chart Properties dialog. Here you can choose the fields to display on the X and Y axis, and modify the look of the plot.
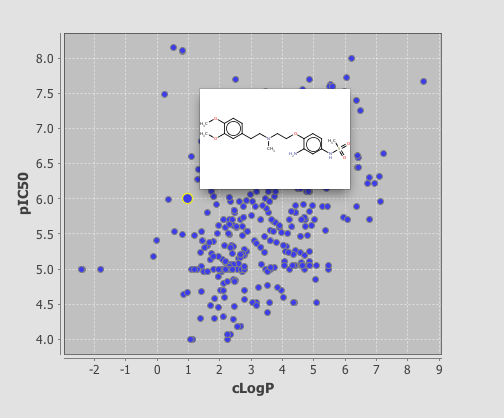
If you now click on the browse tab you can see the plot displayed, I should note I’m using the demo version and it is restricted to 350 rows, unfortunately rather than simply display the first 350 rows you actually need to delete any extra rows before it will display. As you can see below clicking on a point displays the associated structure. If you need to edit the display return to the Design tab and double click on the plot.
One very useful feature is the ability to add a category field, I added the field where I had used the calculated pKa to categorise the molecules into acidic, basic, neutral or zwitterion. As you can see below the plot is now colour coded according to the category field.

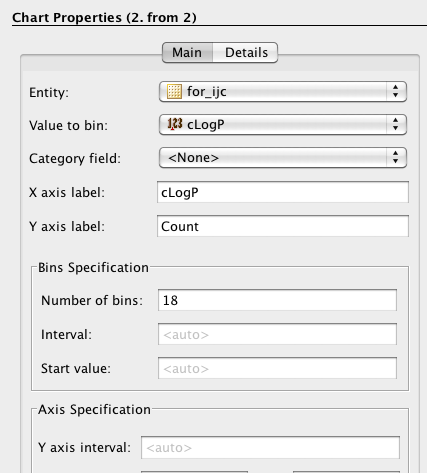
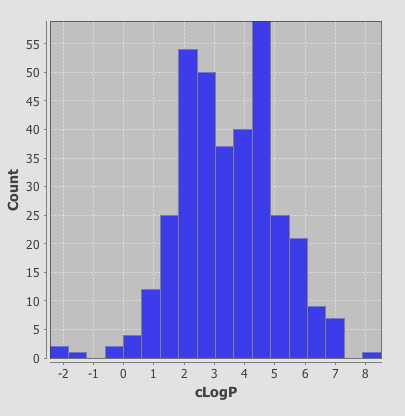
As well as scatter plots it is also possible to add histograms, go to the Design tab, click on the plots icon and this time choose histogram, choose the field to bin and return to the browse tab.
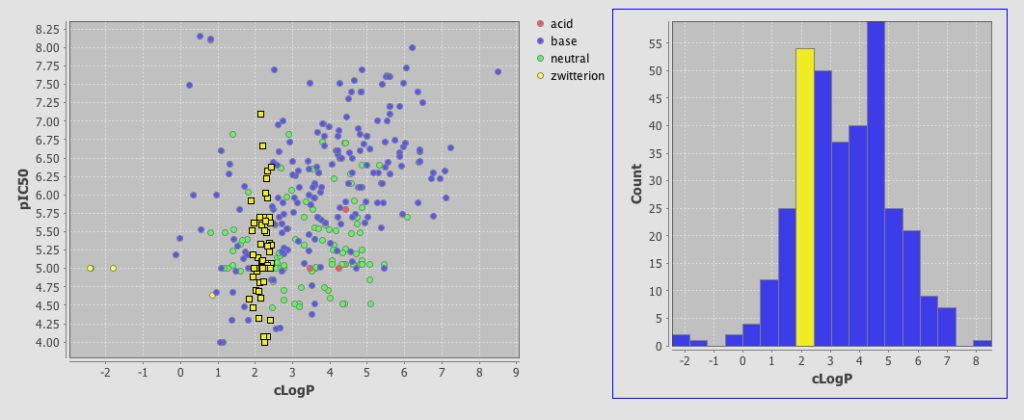
One very nice feature is that the plots are linked so if you click on a column in the histogram plot the corresponding data-points are also highlighted in the scatter plot. This sort of interactivity is absolutely invaluable in exploring structure activity data.
This is a very important addition to Instant JChem, the plotting is in the early stages and there are a number of features that would be useful to have, curve fitting, error bars, regression lines, change symbol on plot based on category, 3D plots, Pi charts etc. but this is an excellent start.