Anyone involved in a drug discovery programme will be aware of the challenge presented by trying to visualise and explore structure-activity relationships (SAR), in particular visualising questions like :-
“What is the largest change that can be made whilst maintaining activity?”
”How does substitution at this position effect affinity?”
Activity Miner from Cresset is a new tool designed to rapidly interrogate and decipher SAR in both Torch and Forge. Activity Miner is intended to help identify key elements of the SAR by starting from a set of aligned molecules and then automatically comparing them to each other. Each pair is given a ‘disparity’ value which reflects how much the activity changes relative to the structure.
Disparity is calculated by dividing the difference in activity between two molecules by the distance between them. In Activity Miner the distance is calculated as ’1 – similarity’ where similarity is either Cresset’s field similarity or the 2-D similarity. Pairs of molecules that have large differences in activity while having good field similarity give high disparities and highlight important aspects of the SAR
In the ‘Activity View’ which is the spiral plot showing compounds with high similarity to a focus compound (focus in the centre, highly similar compounds around the edge). The standard height of each bar shows distance between the lead and that compound (lower the height the closer the compounds are in chemical space). The colour of the bar shows the disparity between the compounds (stronger colour == larger activity cliff [disparity]). The structures around the outside of the spiral have the structural (2D) differences highlighted with a halo effect to aid comparison.
The view on the right shows the 3D structure of the focus compound on the left, and the comparator compound on the right, with their Field differences mapped — the Field differences are shown only where the field is larger i.e. it shows more negative in areas of overall negative field and more positive only in areas of overall positive field (which means it does not show areas where the molecule is less negative or less positive on each of the pair; all the information is displayed, but is separated between the two compounds for clarity.
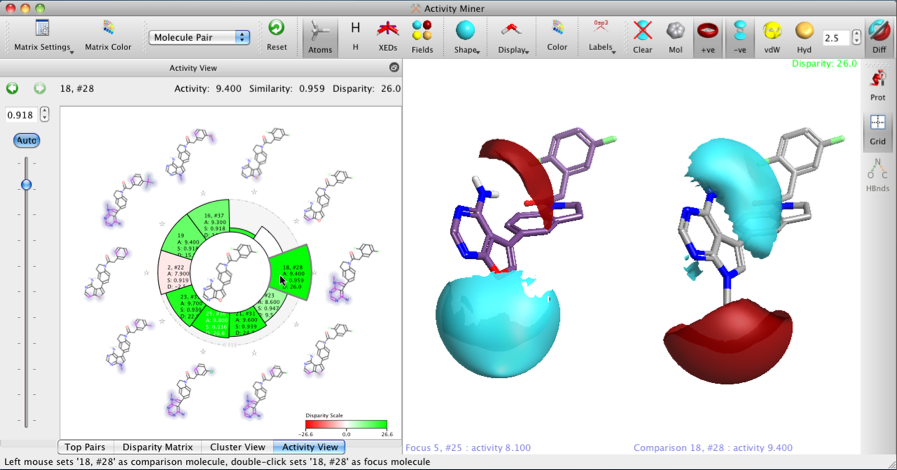
This allows the user to rapidly identify areas of the molecule where significant changes are tolerated, it also helps to identify potential bioisosteric replacements where the 2D similarity maybe have significant differences but the field similarity remains constant.
The two images below show the Disparity Matrix (the Activity View above represents a single row in the matrix below), and the structures on the right of each matrix show either the raw isopotential surfaces or then the Field differences for the same pair of compounds, allowing the user to quickly identify the important pharmacophoric differences.
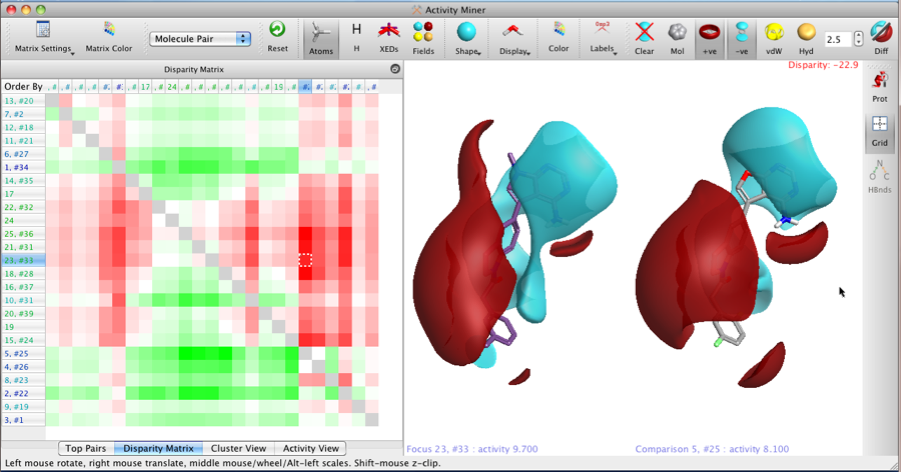
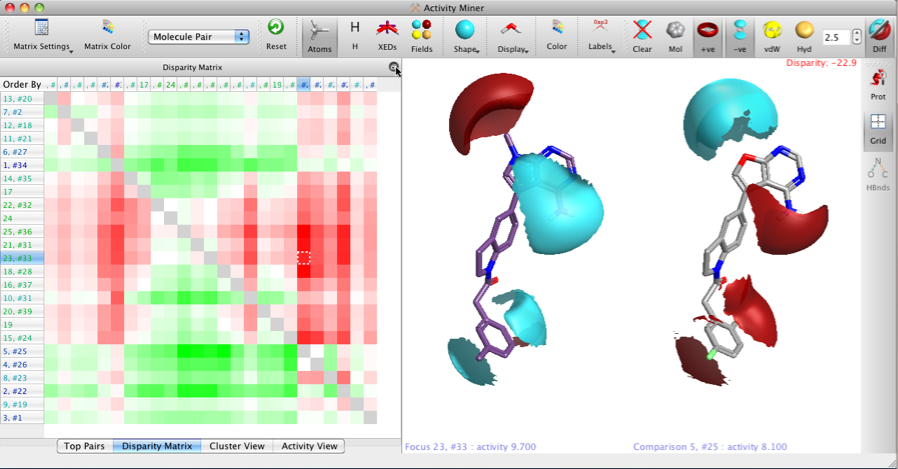
It is also possible to display only the field points, VDW or hydrophobic surfaces.
Activity Miner can also present in a ‘Cluster View’ where the compounds can been clustered using the chosen similarity method and displayed as a hierarchy of clusters in a dendrogram. The currently selected pair of molecules are highlighted in the compound names. Hovering on a name or line displays the structure or cluster information.
Updated 7 October 2013
One thought on “A review of ActivityMiner”
Comments are closed.