Sometimes when you import a dataset into a Vortex workspace the default display can be not ideal. For example I imported this CDK7 dataset from ChEMBL as shown below.
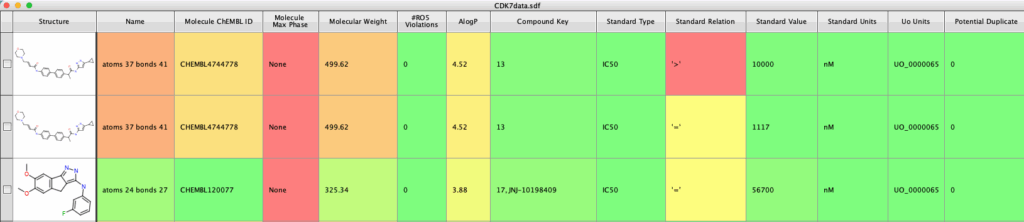
All the data is there but with generic column headers, some not useful columns and not in the best order. However, you can customise the display with a Vortex script.
Vortex display setup script
The script is shown below, the first part is simply a boilerplate of useful imports. The next block simply hides columns that are not needed. You can of course delete these columns. The next step is to rename some columns to something more memorable.
We can also use the script to calculate some properties, only two are shown but Vortex can calculate a whole variety of properties and descriptors.
The next step moves the columns into the order desired. The format for the command is
vtable.moveColumnTo(‘Column to move’, ‘Move to right of this column’)
You can also fix or unfix columns.
The final part is to add colour formatting
|
1 2 3 4 5 6 7 8 9 10 11 12 13 14 15 16 17 18 19 20 21 22 23 24 25 26 27 28 29 30 31 32 33 34 35 36 37 38 39 40 41 42 43 44 45 46 47 48 49 50 51 52 53 54 55 56 57 58 59 60 61 62 63 64 65 66 67 68 69 70 71 72 73 74 75 76 77 |
#Tidy View #Authored by Chris Swain (http://www.macinchem.org) #All rights reserved. # Python imports import urllib2 import urllib # Vortex imports import com.dotmatics.vortex.util.Util as Util import com.dotmatics.vortex.mol2img.jni.genImage as genImage import com.dotmatics.vortex.mol2img.Mol2Img as mol2Img import jarray import binascii import string import os #Hide columns vtable.setColumnHidden("Name") vtable.setColumnHidden("Molecule Name") vtable.setColumnHidden("Molecule Max Phase") vtable.setColumnHidden("Molecular Weight") vtable.setColumnHidden("AlogP") vtable.setColumnHidden("#RO5 Violations") vtable.setColumnHidden("Compound Key") vtable.setColumnHidden("Standard Type") vtable.setColumnHidden("Standard Units") vtable.setColumnHidden("Uo Units") vtable.setColumnHidden("Potential Duplicate") #To delete a column #coldel = vtable.findColumnWithName("Potential Duplicate") #vtable.deleteColumn(coldel) #rename columns col_IC50 = vtable.findColumnWithName("Standard Value") col_IC50.setName('CDK IC50 nM') vtable.setColumnWidth('CDK IC50 nM',60) #calculate properties allStructures = vtable.getStructureTexts() allMW = vortex.getMolProperty(allStructures, 'MW') mwcol = vtable.findColumnWithName('MW', True, vortex.DOUBLE) mwcol.setValuesFromStrings(allMW) allXLogP = vortex.getMolProperty(allStructures, 'XLogP') xlogPcol = vtable.findColumnWithName('XLogP', True, vortex.DOUBLE) xlogPcol.setValuesFromStrings(allXLogP) vtable.fireTableStructureChanged() #Change column order vtable.moveColumnTo('Molecule ChEMBL ID', 'Structure') vtable.moveColumnTo('Standard Relation', 'Molecule ChEMBL ID') vtable.moveColumnTo('CDK IC50 nM', 'Standard Relation') vtable.moveColumnTo('MW', 'CDK IC50 nM') vtable.moveColumnTo('XLogP', 'MW') vtable.fireTableStructureChanged() #To unfix columns #vtable.freeColumn('MW') #color formatting of the IC50 column IC50col = 'minExpression=0;maxExpression=10;minColor=0x00ff00;maxColor=0x00ff00;log=false|minExpression=10;maxExpression=100;minColor=0xffff00;maxColor=0xffa500;log=false|minExpression=100;maxExpression=1000;minColor=0xffa500;maxColor=0xff0000;log=false|minExpression=1000;maxExpression=max;minColor=0xff0000;maxColor=0xff0000;log=false|minExpression=;maxExpression=;minColor=0x00ff00;maxColor=0x00ff00;log=false|minExpression=;maxExpression=;minColor=0x00ff00;maxColor=0x00ff00;log=false|minExpression=;maxExpression=;minColor=0x00ff00;maxColor=0x00ff00;log=false|minExpression=;maxExpression=;minColor=0x00ff00;maxColor=0x00ff00;log=false|minExpression=;maxExpression=;minColor=0x00ff00;maxColor=0x00ff00;log=false|minExpression=;maxExpression=;minColor=0x00ff00;maxColor=0x00ff00;log=false|minExpression=;maxExpression=;minColor=0x00ff00;maxColor=0x00ff00;log=false|minExpression=;maxExpression=;minColor=0x00ff00;maxColor=0x00ff00;log=false|minExpression=;maxExpression=;minColor=0x00ff00;maxColor=0x00ff00;log=false|minExpression=;maxExpression=;minColor=0x00ff00;maxColor=0x00ff00;log=false|minExpression=;maxExpression=;minColor=0x00ff00;maxColor=0x00ff00;log=false|minExpression=;maxExpression=;minColor=0x00ff00;maxColor=0x00ff00;log=false|minExpression=;maxExpression=;minColor=0x00ff00;maxColor=0x00ff00;log=false|minExpression=;maxExpression=;minColor=0x00ff00;maxColor=0x00ff00;log=false$' col_IC50.setColoringMode(2) col_IC50.setColorScheme(IC50col) vtable.fireTableStructureChanged() |
Setting the colouring scheme is done on each individual column. You have 3 options: ColoringMode 0 = the default heat map (min value green high value red) ColoringMode 1 = Custom colour in simple mode, the one you get on the first pane in the Configure.. menu when you right click a column and select ‘Coloring’. ColoringMode 2 = Custom color in advanced mode, the second pane in Coloring > Configure menu. This one you need to by hand in the GUI and then export as a large string that you then have in you code.
If you whant the advanced scheme it is probably best of setting it by hand and then getting the full coloring scheme string for that column and store it as a string that you can then apply to the column in your script. See the screen shot below.
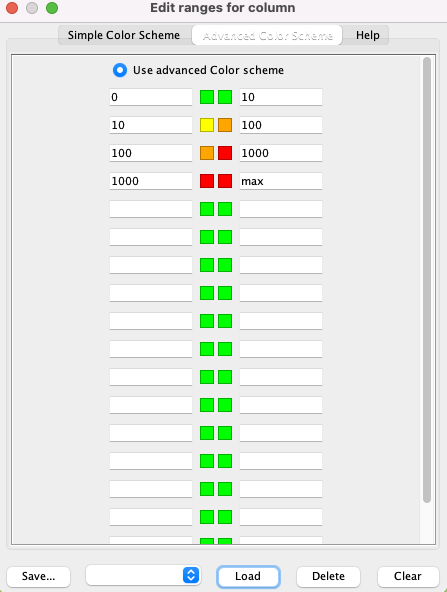
Once you have a colour scheme you like you can then get the code by typing in the Vortex terminal
|
1 2 3 4 |
colIC50 = vtable.findColumnWithName('CDK IC50 nM') colorIC50 = colIC50.getColorScheme() colorIC50 u'minExpression=0;maxExpression=10;minColor=0x00ff00;maxColor=0x00ff00;log=false|minExpression=10;maxExpression=100;minColor=0xffff00;maxColor=0xffa500;log=false|minExpression=100;maxExpression=1000;minColor=0xffa500;maxColor=0xff0000;log=false|minExpression=1000;maxExpression=max;minColor=0xff0000;maxColor=0xff0000;log=false|minExpression=;maxExpression=;minColor=0x00ff00;maxColor=0x00ff00;log=false|minExpression=;maxExpression=;minColor=0x00ff00;maxColor=0x00ff00;log=false|minExpression=;maxExpression=;minColor=0x00ff00;maxColor=0x00ff00;log=false|minExpression=;maxExpression=;minColor=0x00ff00;maxColor=0x00ff00;log=false|minExpression=;maxExpression=;minColor=0x00ff00;maxColor=0x00ff00;log=false|minExpression=;maxExpression=;minColor=0x00ff00;maxColor=0x00ff00;log=false|minExpression=;maxExpression=;minColor=0x00ff00;maxColor=0x00ff00;log=false|minExpression=;maxExpression=;minColor=0x00ff00;maxColor=0x00ff00;log=false|minExpression=;maxExpression=;minColor=0x00ff00;maxColor=0x00ff00;log=false|minExpression=;maxExpression=;minColor=0x00ff00;maxColor=0x00ff00;log=false|minExpression=;maxExpression=;minColor=0x00ff00;maxColor=0x00ff00;log=false|minExpression=;maxExpression=;minColor=0x00ff00;maxColor=0x00ff00;log=false|minExpression=;maxExpression=;minColor=0x00ff00;maxColor=0x00ff00;log=false|minExpression=;maxExpression=;minColor=0x00ff00;maxColor=0x00ff00;log=false$' |
You can then use this string in the script above.
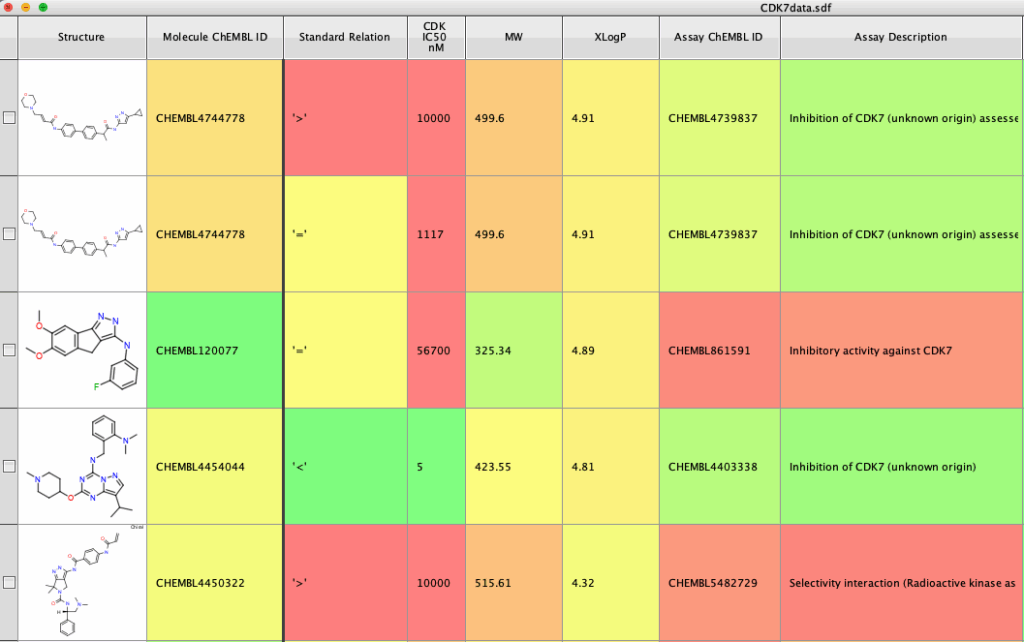
The result is shown below.
Updated
A reader asked how to remove the colouring from a column, to do so you first need to import Column. Then set the default colouring Mode to DEFAULT_COLORING_NONE.
|
1 2 3 4 |
from com.dotmatics.vortex.table import Column col_ID = vtable.findColumnWithName("Molecule ChEMBL ID") col_ID.setDefaultColoringMode(Column.DEFAULT_COLORING_NONE) |