Whilst Excel has been around on the Mac platform since 1985 and is probably the leading spreadsheet application, the data analysis capabilities and statistical analysis is still rather limited. Whilst these limitations may not be an issue for financial or accountancy uses they are a significant obstacle towards scientific use. There are a large number of data analysis tools available on the Mac platform but many are expensive and/or not particularly user friendly.
This is where AnalystSoft hope to take advantage, StatPlus:mac is claimed to turn your copy of excel into a powerful statistical tool. Adding the ability to perform complex calculations and analysis tasks such as normality tests, Pagurova Criterion, correlation coefficients, GLM ANOVA and non-parametric statistical analysis. Use different methods from contingency tables analysis to rank correlations, Probit and Latin squares, Kruskal-Wallis ANOVA and Cochran Q test, without compromising ease of use.
StatPlus:mac is available for both PPC and Intel machines and works with Microsoft Excel 2004 and 2007. For this review I’m using a Dual 2.5 Ghz PPC G5 and Microsoft Excel 2004. Download and installation works smoothly and the application comes with a series of simple tutorials, in html format, and example files. The Help system is excellent and gives detailed information.
StatPlus:mac is not a plugin for Excel but is an indepedent application that can work on Excel files, it is written in AppleScript + optimized for Intel or PPC math core, with all interactions written in AppleScript. Actually it is a great demonstration of what is possible with Applescript. There is no added set of menu items in Excel, instead you need to switch between an open Excel workbook and StatPlus:mac. At first the need to switch between applications seems rather clunky but after a while using “Apple+tab” becomes second nature. After starting StatPlus:mac one of the menu options is “Launch Microsoft Excel”, this opens a blank workbook. This is fine but since you probably have a workbook with data it would be nice to have the option to choose the workbook to open. It also means that if you don’t have a workbook open everytime you switch to StatPlus:mac it opens a new blank workbook which you need to close after replying to the excel dialog box asking if you want to save it, slightly annoying.
A very Simple Example
This is one of the provided examples, two columns of data that you want to compare. From within StatPlus:mac select “Statisctic:Basic Statistics and Tables:Decripttive Statistics” from the menu bar.
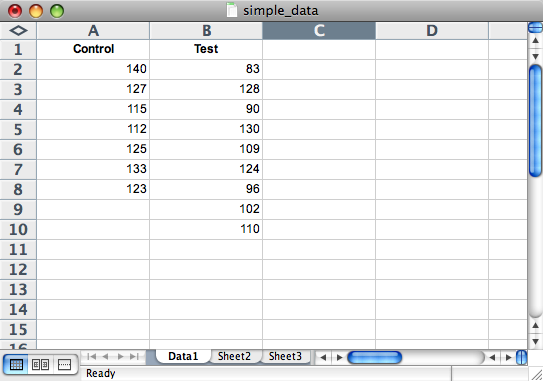
You will be provided with a dialog box asking you to select the data range in the Excel workbook, pleasingly this includes the option for the first row of the spreadsheet to be column labels. You then switch to Excel select the relevant data and then switch back to StatPlus:mac and press OK. A new worksheet is created that contains the statitical analysis.

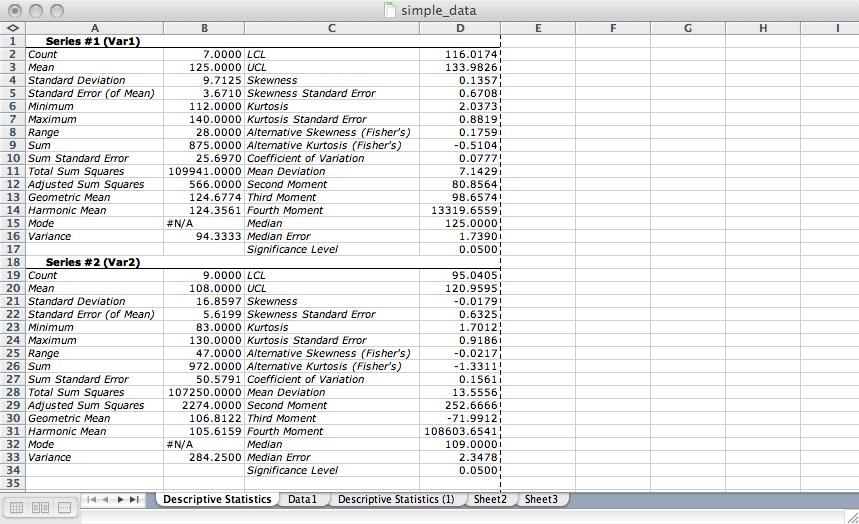
As you can see in the image below, the analysis includes a variety of statistical information. If you look closely at the image a couple of points appear, it would be nice if the labels on the worksheet “Series #1 (Var1)” actually included the label from the datatable “Control”. Also if you have multiple worksheets it might not be easy to work out which analysis refers to which data set, it would be nice if there was an option in the StatPlus:mac dialog box to add your own title to the worksheet, or at least include it in the default lable “Descriptive Statistics (Data1)”
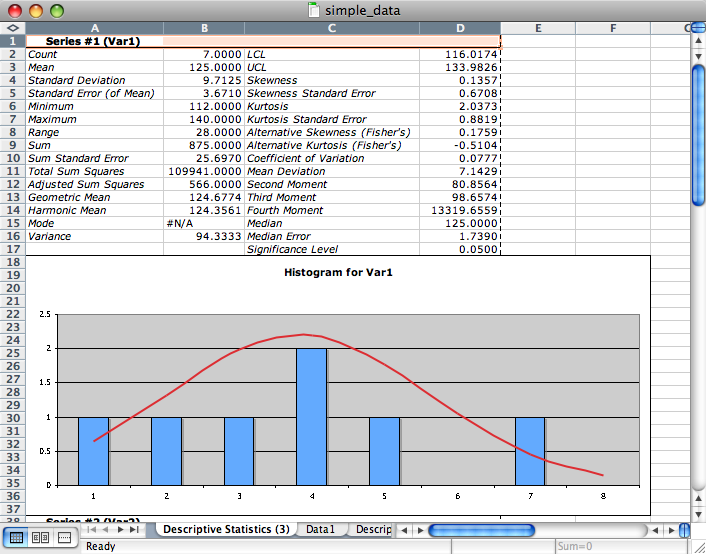
The advanced options in the StatPlus:mac dialog box allow you to add a histogram and a normal curve. This all works nicely but again it would be useful if the StatPlus:mac dialog box included options to include labels for the axes etc. I know you can add these within Excel but it would be useful to do this when you create the graph. Once the graph is embedded you have access to the Excel formatting options, which unfortunately are now looking rather dated (this is of course an Excel issue).
Most experimental data is the result of many experiments and it is necessary to get an idea of the variance in the data set. StatPlus:mac provides ANOVA (one, two and three way) GLM models and Latin squares analysis.
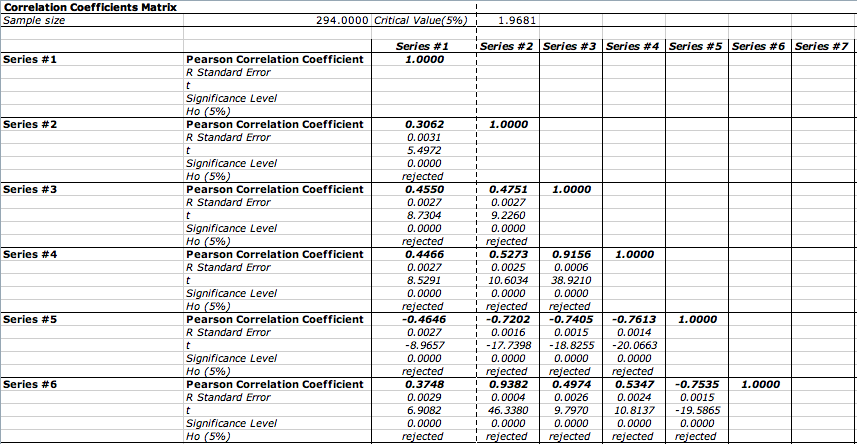
When looking at a new data set it is often useful to look at correlation tables to identify variables that might be highly linearly correlated. StatPlus:mac uses Pearson Product-Moment to compute pairwise correlations between each pair of variables and laces them in a table. Because correlation is symmetric the numbers are symmetric around the diagonalfrom uper left to lower right, thus the resulting printout only displays the lower half of the table. Whilst the computation of a 900 row by 16 column matrix was quick, the subsequent formatting of the results table was rather slow. Again with multiple variables is not trivial to keep track of which series refers to which variable. StatPlus:mac also provides rank correlations Spearman’s rho, Kendall Tau and Gamma.
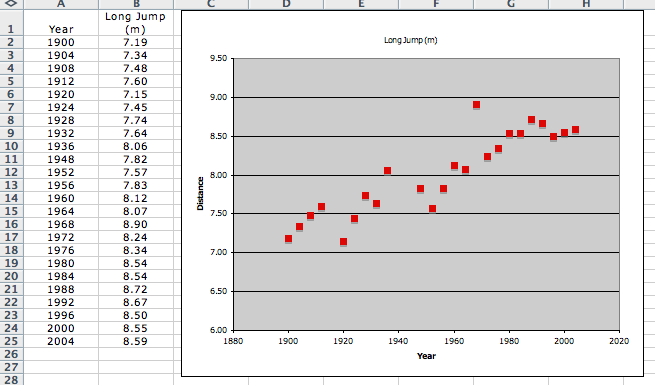
Of course most of the time you will be looking for correlations between experimental data and an array of variables, looking to be a predictive model. Since the Olympics have been in the news recently for ths review I’m using the results from the long jump competiton. As you can see in the image below the winning jump has increased over time.
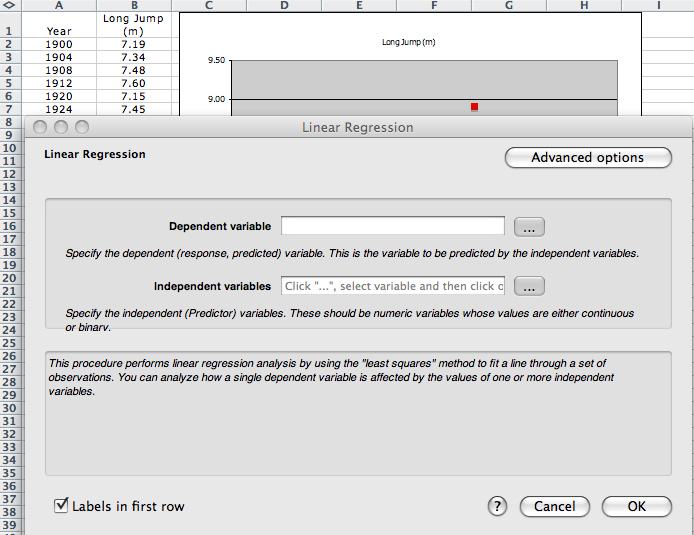
We can now perform a linear regression on this data, simply select “Statistics:Regression:Linear Regression..” from the menu bar and fill in the dialog box.
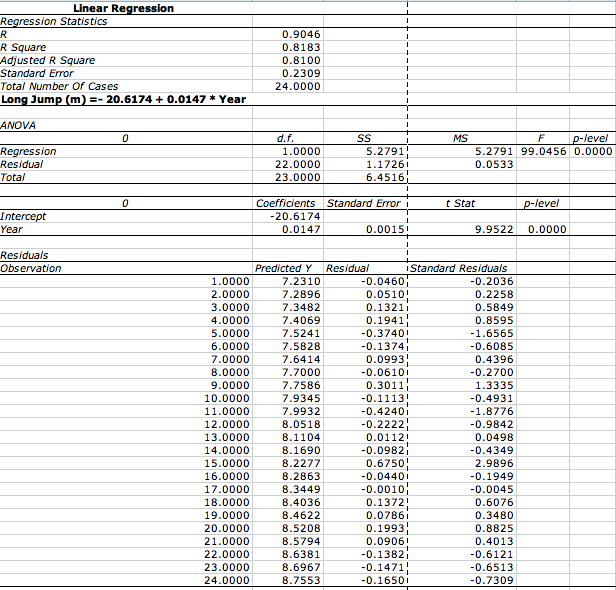
The results are reported in a new worksheet. So based on this the 2008 Long Jump should be won with a distance of – 20.6174 + 0.0147 * 2008 = 8.902! I would have preferred to see “Predicted” and “Actual” data in the report but it contains everything you would need.
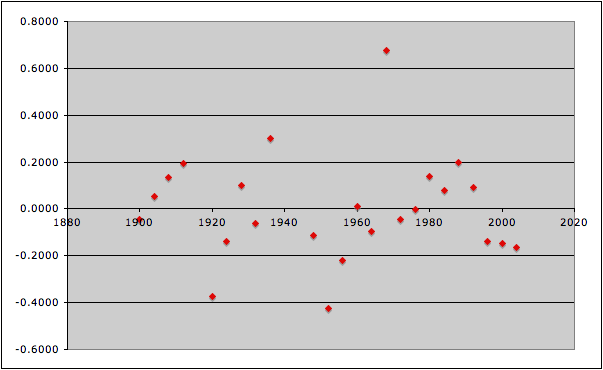
A plot of residuals versus year is shown below and it highlights a couple of things, two years 1920 and 1952 results are below predicted presumably reflecting the result of the World Wars, whilst the 1968 record by Bob Beamon set at altitude in Mexico stands head and shoulders above other years results.
Usually life (and experiments) are not that simple and you need to use multiple regression to descrbe the relationship between a dependent variable and a selection of (possible) predictor variables using either linear or non-linear regression, and StatsPlus:mac provides for simultaneous regression.
StatPlus:mac includes access to a variety of non-parametric statistics useful for dealing wih small datasets or when the quality or distribution of the data is unknown. In additio there are tools supporting time series analysis and survival analysis. Other nice features are the transpose matrix, matrix multiplication and the random sample selection.
Conclusions, integration with Microsoft Excel could be tighter but by maintaining some independence it would presumanly be easy to support other spreadsheet applications in the future. The performance could be a little sluggish at times (especially formatting the results pasted into Excel) but I also did some limited testing on a MacBook Pro and it seemed much faster. I checked many of my calculations using DataDesk and I’m happy to report I got the same answers! The help pages are really excellent giving a useful background to the methods. They also provide tutorials and example datasets. One thing I did find that was if you import a .csv file into Excel the worksheet will be named “filename.csv”, StatPlus then fails to identify the input data, you need to rename the worksheet to exclude the “.”. At around $200 StatPlus:mac is a relatively inexpensive if you already have the Microsoft Excel, combined with the ease of use this could make it an attractive option for some users. One advantage might be that many users would be able to view/share the results in Excel without the need to have access to the stats package, indeed Quickview would allow them to view it without Excel! There are a number of alteratives ranging from free to nearly $4000. If you are going to be performing a wide variety statistical analysis then I’d reccomend learning R (http://www.r-project.org/), KaleidaGraph (http://www.synergy.com/) is similarly priced but has the advantage of not relying on Excel for the plots. DeltaGraph (http://www.redrocksw.com/index_mac.htm) is slightly more expensive but educational discounts are available.