Vortex has a limited capacity to render HTML, it is however a very limited ability so there is no support for javascript or CSS but you can introduce a number of useful extra features.
As shown in this script is possible to have hypertext links that open in the default web browser, in that script a new column is created containing the InChIKey if requested, and a column indicating how many data source hits were obtained together with a link to a locally generated web page (stored in the temporary item folder) containing all the information.
The HTML can also be used to render an external image, this can be useful if you want to add an image of a high-content screen for example. Simply add the following HTML allows you to have the image rendered in the cell in Vortex.
<html><img src=“URL_of_image.jpg" alt="" width="150" height="100"></html>
This will then render the image in the cell as shown below.

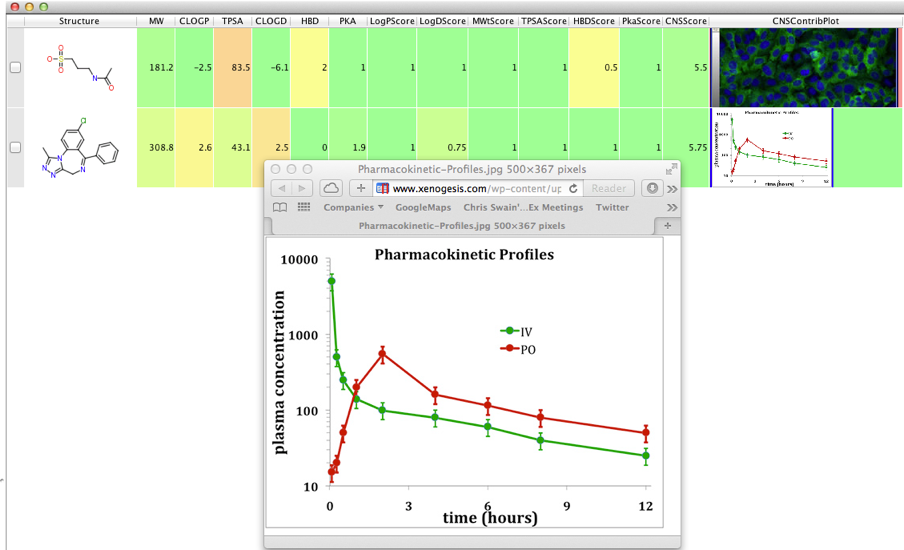
You can also alter the HTML so that when the user clicks on the image a larger version opens in their web browser as shown below.
<html><a href="http://www.xenogesis.com/wp-content/uploads/Pharmacokinetic-Profiles.jpg"><img src="http://www.xenogesis.com/wp-content/uploads/Pharmacokinetic-Profiles.jpg" alt="" width="150" height="100"></a></html>

If the images are stored on a server with a unique ID (perhaps the compoundID) it should be possible to have a calculation that generates the HTML automatically.
Using a Web Service
A couple of the scripts access a web service to provide calculated properties, or give access to database data, however there are now many web services providing useful functionalities. Google provide the (sadly deprecated) Image Charts, this is a relatively simple API that allows you to dynamically generate charts with a URL string.
The Google Chart API returns a chart image in response to a URL GET or POST request. The API can generate many kinds of charts, from pie or line charts to QR codes and formulas. All the information about the chart that you want, such as chart data, size, colors, and labels, are part of the URL.
The URL has this format
https://chart.googleapis.com/chart?cht=p3&chd=t:60,40,70,90&chs=250x100&chl=Prop1|Prop2|Prop3|Prop4
To have it display in the page we have to URLencode so “&” gets changed to “&”
<img alt="<GoogleChart>" src="https://chart.googleapis.com/chart?cht=p3&chd=t:60,40,70,90&chs=250x100&chl=Prop1|Prop2|Prop3|Prop4">
This is then rendered to give the following plot.

Vortex Script
Sune Askjær, the author of the Unichem Script, suggested a nice addition to the CNScalcFromPropsintTable script, first we add another column to the workspace
colRadarPlot = vtable.findColumnWithName('CNSContribPlot', 1)
Then we construct the HTML to place in the new column, after first concatenating the data values.
# Values for Radar plot
radar_values = ",".join([str(logDscore) , str(pkascore), str(tpsascore), str(Mwtscore), str(hbdscore), str(logPscore), str(logDscore)])
img_url = 'http://chart.apis.google.com/chart?cht=rs&chds=0,1&chco=000000&chs=130x115&chxs=0,000000,10&chxt=x&chxl=0:|LogD|pKa|TPSA|MW|Donors|cLogP&chm=B,00FF0075,0,0,0|h,00FF0050,0,0.95,7|h,FF000050,0,0.1,12|h,FFFF0050,0,0.55,15&chd=t:' + radar_values
colRadarPlot.setString(r, '<html><img src="' + img_url + '"></html>')
The results can be seen below.

The script can be downloaded from here
This script is an updated version of the one created in the previous tutorial.
Page Updated 17 June 2014