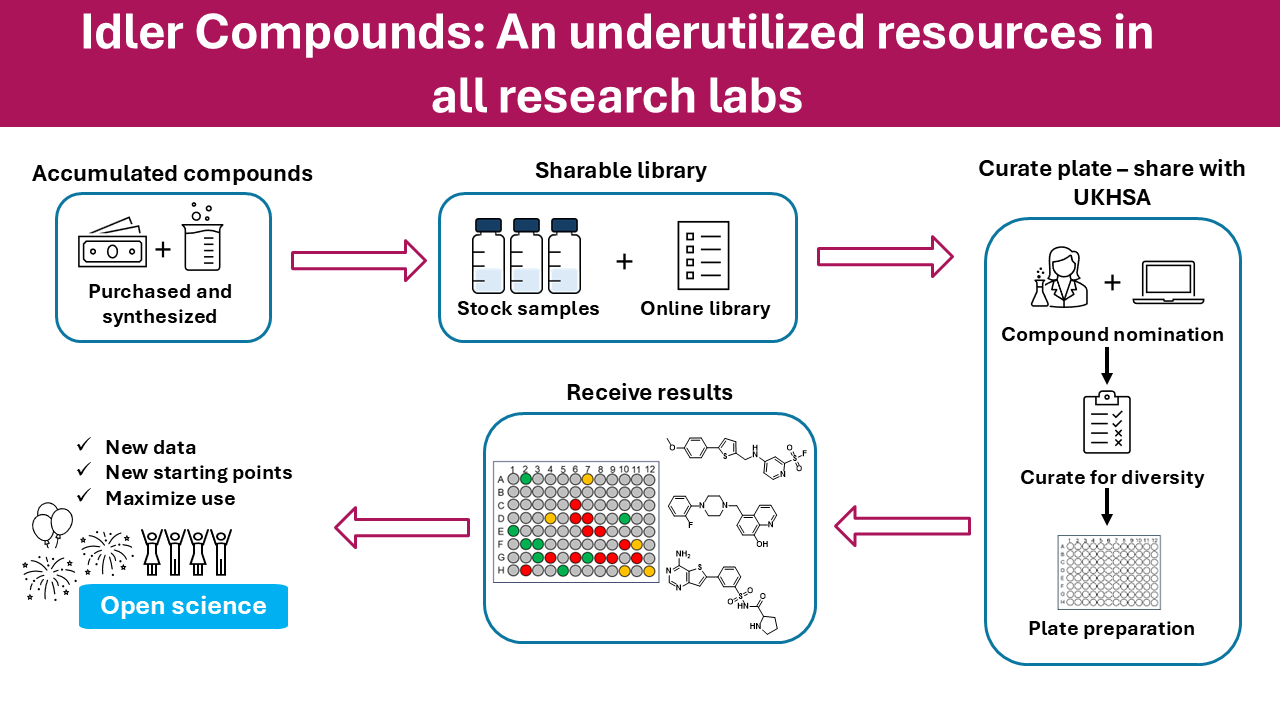
There was an interesting publication from the Todd group at UCL on Chemrxiv “Idler Compounds: A Simple Protocol for Openly Sharing Fridge Contents for Cross-Screening” https://chemrxiv.org/doi/10.26434/chemrxiv-2025-nqjb4. Now published https://pubs.acs.org/doi/10.1021/acs.jmedchem.5c02354.
Matt Todd is heavily involved in a number of open-source drug discovery projects and this paper highlights the opportunity this brings for sharing molecules that have been made for one project with other unrelated biological targets.
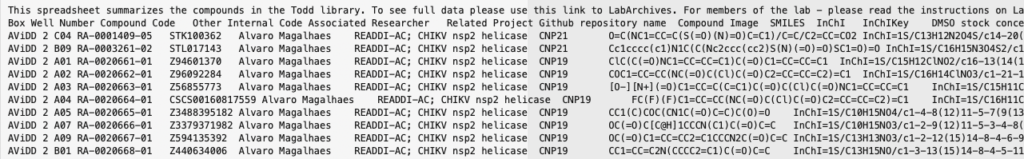
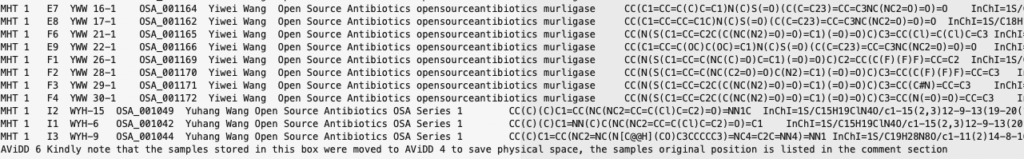
Since the structures are in the public domain it is possible for anyone to access them, details are on GitHub https://todd-lers.github.io/about/idler.html. However, whilst a Google sheet does provide easy access it is not chemically intelligent. This Jupyter notebook shows how to download the data, then import it into a Pandas data frame and then use RDKit to convert the SMILES strings to molecular objects, these can then be used to calculate physicochemical properties.
A Jupyter Notebook to access structures and data from the Idler master worksheet
This notebook demonstates how to get the structures and data from the Google worksheet, then convert the SMILES to molecule objects that allow some simple manipulisations and visualisations. SMILES (Simplified Molecular Input Line Entry System) is a line notation (a typographical method using printable characters) for entering and representing molecules and reactions. https://www.daylight.com/dayhtml/doc/theory/theory.smiles.html
Getting the data
#https://docs.google.com/spreadsheets/d/1heWWU_xi_NSQRvNA5_wRuw_vl9IhMzXtihmAKnpZMWw/export?format=tsv&gid=2078630269
#First get data from Google doc

!wget -O example.tsv "https://docs.google.com/spreadsheets/d/1heWWU_xi_NSQRvNA5_wRuw_vl9IhMzXtihmAKnpZMWw/export?format=tsv"
#The data is downloaded to a file called example.tsv in the same folder as the notebook, in tab separated format
Import the required python modules and then import the example.tsv file into a Pandas dataframe called datafile
from rdkit.Chem import AllChem as Chem
from rdkit.Chem.Draw import IPythonConsole
from rdkit.Chem import PandasTools
from rdkit.Chem import Draw


import pandas as pd
#datafile = pd.read_table('./export?format=tsv')
datafile = pd.read_csv('example.tsv', sep = '\t', skiprows=1, skipfooter =1, engine = "python")
#Allow inline images
%matplotlib inline
#View first five rows
datafile.head(5)
#Find how many rows
len(datafile.index)
Convert the SMILES string to an RDKit molecular object
At the moment the molecule structures are represented by a SMILES string, we can convert the SMILES string to an RDKit molecular object and then display
#Remember the first row is row zero.
smiles = datafile['SMILES'].loc[3]
#convert SMILES string to a RDKit molecular object
mol = Chem.MolFromSmiles(smiles)
mol
We can see the different datatypes in the dataframe
datafile.dtypes
Adding structures to pandas dataframe
We can now convert the SMILES string to a RDKit molecular object for every row in the dataframe
PandasTools.AddMoleculeColumnToFrame(datafile,smilesCol='SMILES')
datafile.dtypes
If we view the dataframe the molecule object has been added to the last column. It would be better if the structure was more readily visible. So we change the column order.
datafile.tail(3)
#display the current order
cols = list(datafile.columns.values)
cols
datafile.head(3)
If we want to view structures we can diaplay them as a grid
PandasTools.FrameToGridImage(datafile,column= 'ROMol', molsPerRow=4,subImgSize=(150,150),legendsCol="Compound Code")
Calculation of molecule properties
Now calculate a variety of properties using RDKit, adding them to the end of the dataframe. you can choose which properties to add here.
# Some of the availble descriptors are described here http://rdkit.org/docs/source/rdkit.Chem.rdMolDescriptors.html
from rdkit.Chem import rdMolDescriptors
hbdlist = [] #hydrogen bond donors
hbalist = [] #hydrogen bond acceptors
tpsalist = [] #Total polar surface area
mwtlist = [] #Exact molecular weight
logPlist = [] #Crippen LogP
mrlist = [] #Crippen MR
for mol in datafile['ROMol']:
    hbd = rdMolDescriptors.CalcNumHBD(mol)
    hbdlist.append(hbd)
    hba = rdMolDescriptors.CalcNumHBA(mol)
    hbalist.append(hba)
    TPSA = rdMolDescriptors.CalcTPSA(mol)
    tpsalist.append(TPSA)
    mwt = rdMolDescriptors.CalcExactMolWt(mol)
    mwtlist.append(mwt)
    crippen = rdMolDescriptors.CalcCrippenDescriptors(mol) #returns a 2-tuple with the Wildman-Crippen logp,mr values
    logPlist.append(crippen[0])#first is logP
    mrlist.append(crippen[1])#second is mr
mrlist
We now add each of the properties to the dataframe
datafile['HBD']=hbdlist
datafile['HBA']=hbalist
datafile['TPSA']=tpsalist
datafile['MWt']=mwtlist
datafile['LogP']=logPlist
datafile['MR']=mrlist
datafile.head(3)
We can also add a molecular properties
datafile['NumHeavyAtoms']=datafile.apply(lambda x: x['ROMol'].GetNumHeavyAtoms(), axis=1)
datafile.head(3)
Plotting properties
We can using seaborn (http://seaborn.pydata.org/index.html) a Python visualization library based on matplotlib to generate a variety of plots.
import seaborn as sns
myTPSA = datafile['TPSA']
myMWt = datafile['MWt']
#Scatter plot
sns.scatterplot(x = myMWt, y = myTPSA,)
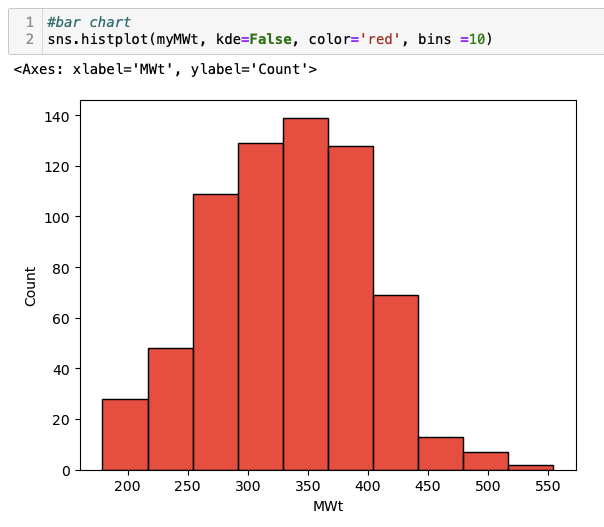
#bar chart
sns.histplot(myMWt, kde=False, color='red', bins =10)
A couple of points
In the first cell we use wget a tool for downloading files using HTTP, HTTPS, FTP and FTPS. Note that it is preceded by an exclamation mark.
|
1 |
!wget -O example.tsv "https://docs.google.com/spreadsheets/d/1heWWU_xi_NSQRvNA5_wRuw_vl9IhMzXtihmAKnpZMWw/export?format=tsv" |
This allows Jupyter to run shell commands within cells, the file is saved as example.tsv (tab separated format). This can then be imported into a pandas data frame using RDKit tools. However, the first row of the file contains a description
and the final row is a comment. We don’t want to import these rows so we skip the header and footer, using Python as the parser engine (Python parser engine if more feature complete).
|
1 |
datafile = pd.read_csv('example.tsv', sep = '\t', skiprows=1, skipfooter =1, engine = "python") |
The SMILES strings are then converted to RDKit molecular objects.
|
1 |
PandasTools.AddMoleculeColumnToFrame(datafile,smilesCol='SMILES') |
These can then be rendered using a couple of options, a variety of physicochemical properties are calculated and plotted using seaborne.