t-distributed stochastic neighbor embedding (t-SNE) is a statistical method for visualizing high-dimensional data by giving each datapoint a location in a two or three-dimensional map.
Whilst there are a number of options for clustering molecules with some options ideal for very large datasets the results are sometimes not ideal for interactive exploration (an alternative is PCA). I like t-SNE because the local structure of the dataset is maintained.
This Jupyter notebook uses t-SNE from the scikit-learn package, and Morgan fingerprints generated using RDKit. The NK1 IC50 antagonist data is taken from ChEMBL, target CHEMBL249. (https://www.ebi.ac.uk/chembl/explore/target/CHEMBL249). Data flagged by the ChEMBL team as unreliable was removed. The hNK1 IC50 is in the “Standard Value” field.
The Jupyter notebook is shown below. The generation of the different fingerprints has now been updated to use a consistent api https://greglandrum.github.io/rdkit-blog/posts/2023-01-18-fingerprint-generator-tutorial.html
The idea of the new code is that all supported fingerprinting algorithms can be used the same way: you create a generator for that fingerprint algorithm with the appropriate parameters set and then ask the generator to give you the fingerprint type you want for each molecule.
The old way to generate the Morgan fingerprints was
ECFP_fps = [AllChem.GetMorganFingerprintAsBitVect(x,radius=radius, nBits=nBits) for x in AllStruturesDF['ROMol']]Now we create a generator and then use it to yield the fingerprint.
mfpgen = rdFingerprintGenerator.GetMorganGenerator(radius=radius,fpSize=nBits)
ECFP_fps = [mfpgen.GetFingerprint(x) for x in AllStruturesDF['ROMol']]
The full notebook is shown below.
import base64
from io import BytesIO

import pandas as pd
import numpy as np
from rdkit.Chem.Draw import rdMolDraw2D
from rdkit.Chem import AllChem
from rdkit import Chem
from rdkit.Chem import rdFingerprintGenerator
from rdkit.Chem import PandasTools
from sklearn.decomposition import PCA
from sklearn.manifold import TSNE
from plotly.graph_objects import Figure
import plotly.express as px
#Requires sdf file containing structure, IDNUMBER and Property
mols=Chem.SDMolSupplier('/Users/chrisswain/Desktop/Neurokinins/NK1ForTSNE.sdf')
print (len(mols)) #To check how many molecules there are in the file
2191
SDFFile = "/Users/chrisswain/Desktop/Neurokinins/NK1ForTSNE.sdf"
AllStruturesDF = PandasTools.LoadSDF(SDFFile)
AllStruturesDF.head(10)
| IDNUMBER | Standard Value | ID | ROMol | |
|---|---|---|---|---|
| 0 | CHEMBL249145 | 0.07 | <rdkit.Chem.rdchem.Mol object at 0x33cd303c0> | |
| 1 | CHEMBL2112743 | 0.21 | <rdkit.Chem.rdchem.Mol object at 0x33cd31930> | |
| 2 | CHEMBL195222 | 10.0 | <rdkit.Chem.rdchem.Mol object at 0x33cd31b60> | |
| 3 | CHEMBL1256592 | 1.7 | <rdkit.Chem.rdchem.Mol object at 0x33cd31cb0> | |
| 4 | CHEMBL1258967 | 1.0 | <rdkit.Chem.rdchem.Mol object at 0x33cd31d20> | |
| 5 | CHEMBL1258623 | 3.2 | <rdkit.Chem.rdchem.Mol object at 0x33cd31d90> | |
| 6 | CHEMBL1258623 | 15.0 | <rdkit.Chem.rdchem.Mol object at 0x33cd31e00> | |
| 7 | CHEMBL1257706 | 0.061 | <rdkit.Chem.rdchem.Mol object at 0x33cd31e70> | |
| 8 | CHEMBL1257357 | 0.06 | <rdkit.Chem.rdchem.Mol object at 0x33cd31ee0> | |
| 9 | CHEMBL1651026 | 0.24 | <rdkit.Chem.rdchem.Mol object at 0x33cd31f50> |
#if there are molecules that can't be sanitised. Export and start again.

#CleanMols = 'Clean.sdf.gz'

#PandasTools.WriteSDF(AllStruturesDF, CleanMols, molColName="ROMol", idName="IDNUMBER", properties=list(AllStruturesDF.columns))
radius=3
nBits=2048

#ECFP_fps = [AllChem.GetMorganFingerprintAsBitVect(x,radius=radius, nBits=nBits) for x in AllStruturesDF['ROMol']]
mfpgen = rdFingerprintGenerator.GetMorganGenerator(radius=radius,fpSize=nBits)
ECFP_fps = [mfpgen.GetFingerprint(x) for x in AllStruturesDF['ROMol']]
ECFP_fps
[<rdkit.DataStructs.cDataStructs.ExplicitBitVect at 0x33da7b680>,
 <rdkit.DataStructs.cDataStructs.ExplicitBitVect at 0x33da7b610>,
 <rdkit.DataStructs.cDataStructs.ExplicitBitVect at 0x33da7b6f0>,
 <rdkit.DataStructs.cDataStructs.ExplicitBitVect at 0x33da7b760>,
 <rdkit.DataStructs.cDataStructs.ExplicitBitVect at 0x33da7b7d0>,
 ...]
temp = np.array(ECFP_fps)

model = TSNE(n_components=2, random_state=0, perplexity=30, n_iter=2000)


tsne_model = model.fit_transform(temp)
#temp
model = TSNE(n_components=2, random_state=0, perplexity=30, n_iter=2000)


tsne_model = model.fit_transform(temp)
tsne_model
array([[ 58.444973,  14.833329],
       [ 65.73089 , -20.413094],
       [ 16.242067,  17.436546],
       ...,
       [-14.718664,   8.514211],
       [ 26.329285, -39.011486],
       [ 47.516994, -60.787254]], dtype=float32)
from numpy import asarray
from numpy import savetxt

#save to csv file
savetxt('data.csv', tsne_model, delimiter=',')
df_new = pd.concat([AllStruturesDF, pd.DataFrame(tsne_model)], axis=1)
df_new = df_new.drop('ID', axis=1)
df_new.head(2)
| IDNUMBER | Standard Value | ROMol | 0 | 1 | |
|---|---|---|---|---|---|
| 0 | CHEMBL249145 | 0.07 | <rdkit.Chem.rdchem.Mol object at 0x33cd303c0> | 58.444973 | 14.833329 |
| 1 | CHEMBL2112743 | 0.21 | <rdkit.Chem.rdchem.Mol object at 0x33cd31930> | 65.730888 | -20.413094 |
#rename columns
df_new.columns = ['IDNUMBER', 'hNK1 IC50', 'ROMol', 'T1', 'T2']
df_new.head(10)
| IDNUMBER | hNK1 IC50 | ROMol | T1 | T2 | |
|---|---|---|---|---|---|
| 0 | CHEMBL249145 | 0.07 | <rdkit.Chem.rdchem.Mol object at 0x33cd303c0> | 58.444973 | 14.833329 |
| 1 | CHEMBL2112743 | 0.21 | <rdkit.Chem.rdchem.Mol object at 0x33cd31930> | 65.730888 | -20.413094 |
| 2 | CHEMBL195222 | 10.0 | <rdkit.Chem.rdchem.Mol object at 0x33cd31b60> | 16.242067 | 17.436546 |
| 3 | CHEMBL1256592 | 1.7 | <rdkit.Chem.rdchem.Mol object at 0x33cd31cb0> | 84.092636 | 4.182265 |
| 4 | CHEMBL1258967 | 1.0 | <rdkit.Chem.rdchem.Mol object at 0x33cd31d20> | 83.332939 | 9.480635 |
| 5 | CHEMBL1258623 | 3.2 | <rdkit.Chem.rdchem.Mol object at 0x33cd31d90> | 80.726463 | 7.901600 |
| 6 | CHEMBL1258623 | 15.0 | <rdkit.Chem.rdchem.Mol object at 0x33cd31e00> | 80.725914 | 7.901782 |
| 7 | CHEMBL1257706 | 0.061 | <rdkit.Chem.rdchem.Mol object at 0x33cd31e70> | 81.618469 | 4.934827 |
| 8 | CHEMBL1257357 | 0.06 | <rdkit.Chem.rdchem.Mol object at 0x33cd31ee0> | 83.896553 | 7.351902 |
| 9 | CHEMBL1651026 | 0.24 | <rdkit.Chem.rdchem.Mol object at 0x33cd31f50> | -30.282125 | 22.914145 |
combinedResults = 'Alldata.sdf.gz'

PandasTools.WriteSDF(df_new, combinedResults, molColName="ROMol", idName="IDNUMBER", properties=list(df_new.columns))
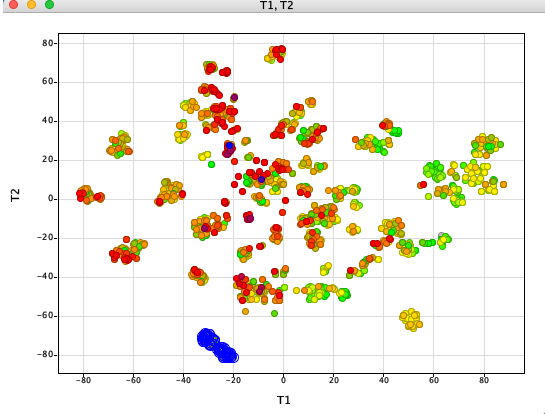
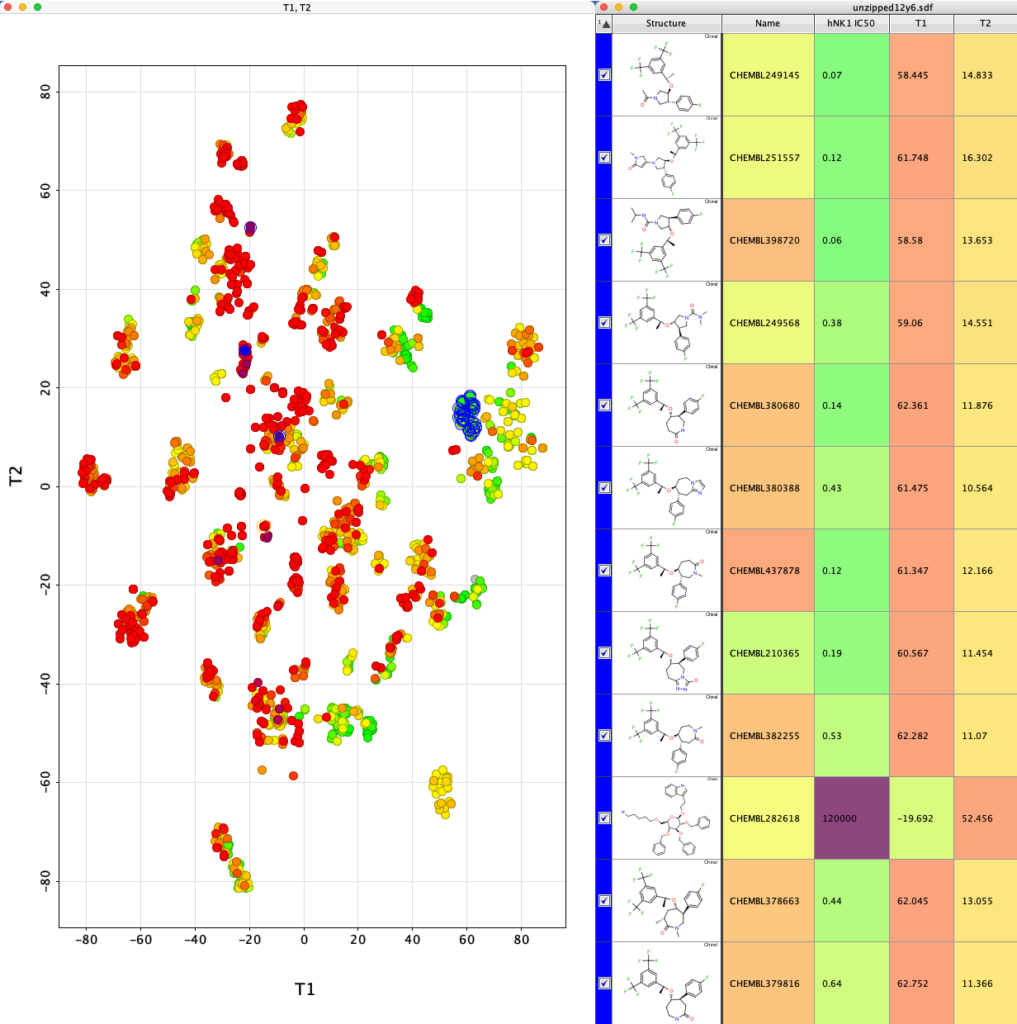
The whole process is very quick taking less than a minute on my desktop machine. The resulting dataframe is then exported as a compressed sdf file (Alldata.sdf.gz). This can be read into Vortex for display as shown below. You could also use DataWarrior.
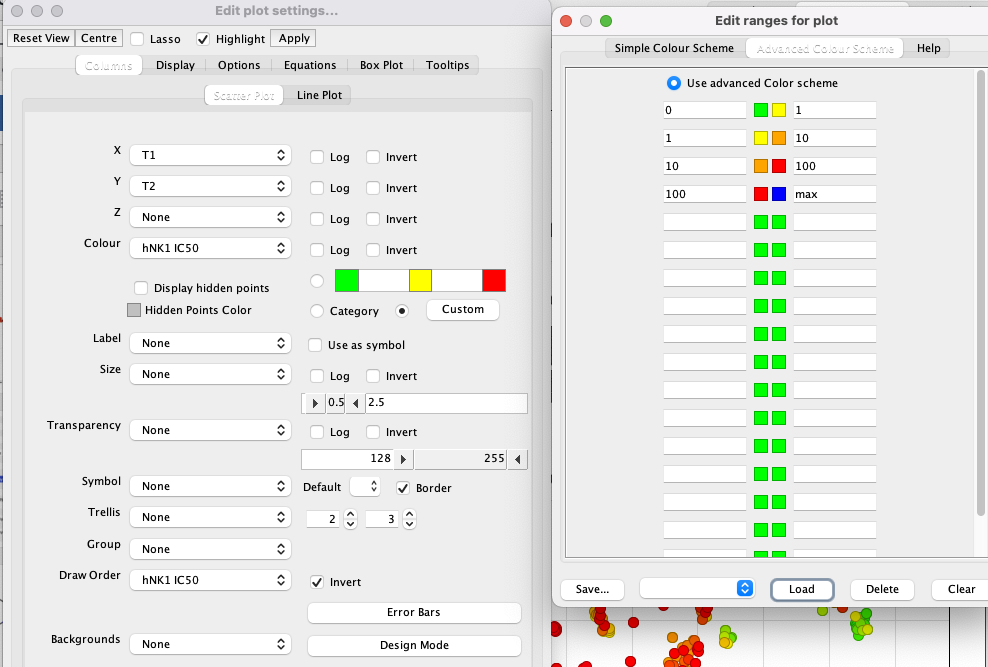
I’ve used a custom colour coding for points based on the hNK1 IC50 data for display.
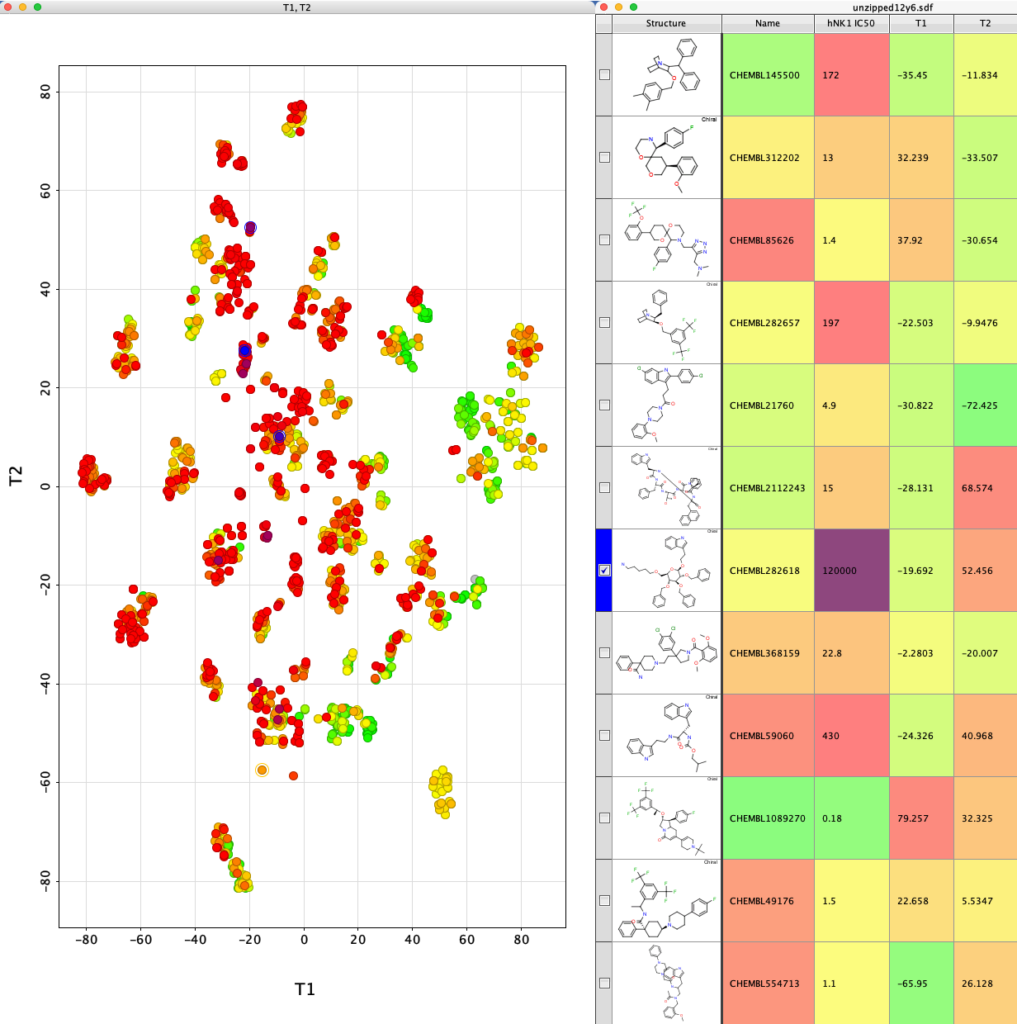
If we now select one of the clusters the corresponding molecules are highlighted in the table.
We can use the slider on the right (highlighted in red box below) to display only molecules with hNK1 IC50 < 1 nM and then select the different classes of potent NK1 antagonists.
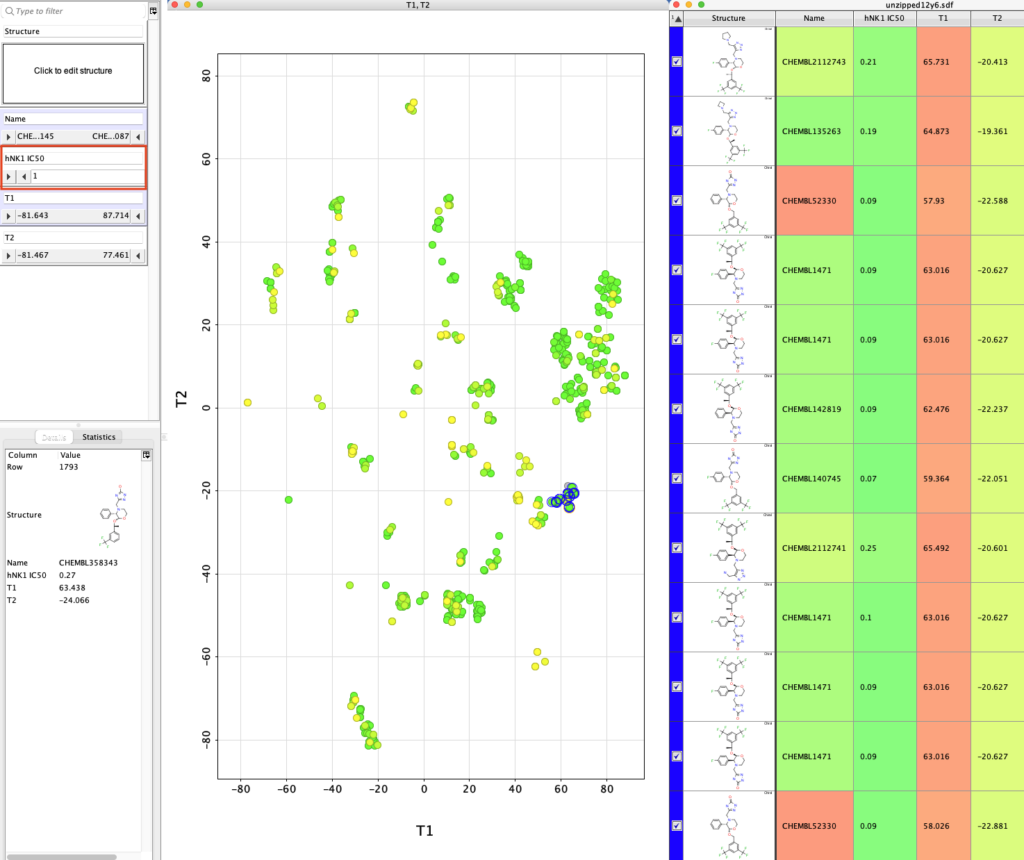
You ca also add a variety of calculated physicochemical properties to the table and use them to filter the selection.