Exploration and sorting large datasets of molecules often involves the use of clustering techniques to group together molecules with similar properties. It can be used to flag outliers or highlight particular patterns, functional groups, or scaffolds. There are many clustering algorithms such as partitioning clustering, hierarchical clustering and many different descriptors can be used including binary fingerprints, structural keys, and derived keys. Clustering can be very computationally intensive and some algorithms are best suited to modest datasets. There is a review of some of the clustering options here.
K-means clustering (Huang Z. Extensions to the K-Means Algorithm for Clustering Large Data Sets with Categorical Values, Data Min. Knowl. Discov. 1998, 2, 283-304) is implemented within Vortex and is able to handle relatively large datasets (>10M records).
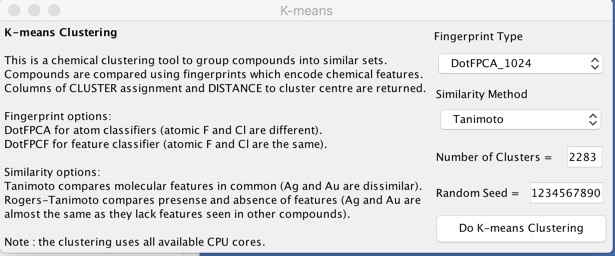
During the clustering two columns are added: a CLUSTER number, and a DISTANCE; the centroid has a distance of 0 and all other compounds vary in distance up to 1. Whilst the clustering is relatively straight-forward analysis of a large number of clusters can be difficult so here are a selection of Vortex scripts that might be useful.
With millions of structures it is not really practical to simply scroll through the table, but here are a couple of tools that might help with further analysis.
ClusterAnalysis
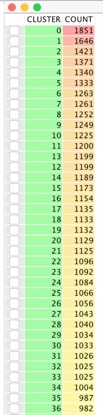
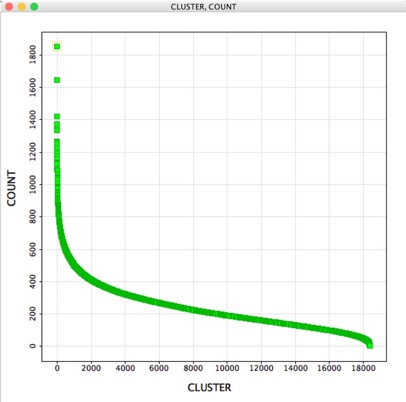
A question that might then arise is “How many molecules belong to each cluster?”, the “ClusterAnalysis.vpy” script creates a new workspace containing two columns. The first containing the cluster number the second the count of occurrences for each cluster, for a million structures it took a couple of seconds to run. The results can be viewed as a table or a scatter plot.
Select Centroid from each cluster
One way to select a subset that represents the diversity of a large collection of molecules is to cluster and then select the centroid of each cluster. The “ChoseCentreFromClusters.vpy” does exactly that, it takes as input the CLUSTER column and the DISTANCE column and for each cluster selects the lowest distance. A new column is added called SELECTED, the selected could then be exported to a new workspace or exported to a file.
    bestScores = {}

    rows = vtable.getRealRowCount()
    for r in range(0, int(rows)):
        molName = colname.getValueAsString(r)
        molScore = colscore.getValue(r)

        # Update score in bestScores if not seen yet or if better than previous
        if molName not in bestScores or (molName in bestScores and molScore < bestScores[molName][0]):
            bestScores[molName] = (molScore, r)
Calculate cluster diversity
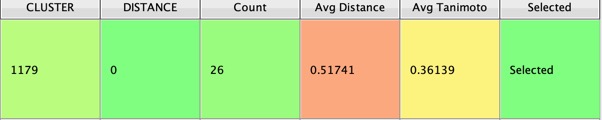
Whilst the above script is a useful first step sometimes you want to know a little more information about the diversity within the clusters. For example you may decide to select additional examples from more diverse clusters. This script “CalcClusterDiversity.vpy” takes as input the CLUSTER, DISTANCE and the fingerprint used (Default = DotFPCA_1024). The script selects the centroid based on the DISTANCE column, and then adds several new columns “Count”, “Avg Distance” and “Avg Tanimoto”. The Count is the number of molecules within each cluster, the Avg Distance is the average of the distances from centroid within the cluster, and Avg Tanimoto is the average of the Tanimoto coefficient when comparing every molecule with all other molecules within the cluster. This script can be slow if there are very large clusters.
Select First from each cluster
In some cases you might not want to select the centroid, this script “ChoseFirstFromClusters.vpy” simply selects the first member encountered from each cluster
Select Random from each cluster
Sometimes you might to chose a random selection from each cluster “SelectRandomFromClusters.vpy”. To change the number of molecules selected from each cluster change the value of “numselected” as shown below.
clusterrows = collections.defaultdict(list) #rows in cluster
randomrows = []
selectedrows = [] # list of selected random rows from each cluster

# Iterate all compounds
for r in range(0, vtable.getRealRowCount()):
    cluster = cluster_col.getValueAsString(r)

    # Append all the rows in the cluster
    clusterrows[cluster].append(r)
numselected = 2 # the number to randomly select from each cluster
# Iterate each cluster
for cluster in clusterrows:
    rowlist = clusterrows[cluster]
    if len(rowlist) >= numselected:
        randomrows = random.sample(rowlist,numselected)
        for n in randomrows:
            selectedrows.append(n)
    elif len(rowlist) < numselected:
        randomrows = rowlist
        for n in randomrows:
            selectedrows.append(n)

for r in selectedrows:
    SelColumn.setValueFromString(r, "Selected")
Of course if numselected is greater than the size of the smaller cluster this would cause an error, so we check the length of “rowlist” and if it is smaller than “numselected” we simply choose all members of the cluster.
Calculate Average LogP of the Cluster
Whilst the fingerprints are an excellent way to determine diversity within a cluster sometimes you might be interested in the variation of a property. This script “CalcClusterAverageLogP.vpy” calculates the average calculated LogP within a cluster, together with the size of each cluster and centroid. Again you might want to select additional molecules from clusters with a preferred LogP range. This script could be easily modified to accommodate any property calculated within the workspace.
# Dicts to keep track of cluster properties
best_dist = {}
total_dist = collections.defaultdict(float)
total_logp = collections.defaultdict(float)
total_count = collections.defaultdict(int)

# Iterate all compounds
for r in range(0, vtable.getRealRowCount()):
    cluster = cluster_col.getValueAsString(r)
    dist = dist_col.getValue(r)
    logp = logp_col.getValue(r)

    # Update best dist if cluster not seen yet or better than previous
    if cluster not in best_dist or dist < best_dist[cluster][1]:
      best_dist[cluster] = (r, dist)

    # Keep a running sum of distances and count for each cluster
    total_dist[cluster] += dist
    total_logp[cluster] += logp
    total_count[cluster] += 1

# Set output properties on lowest distance compound in each cluster
for cluster, (r, dist) in best_dist.items():
    cluster_dist = total_dist[cluster]
    logp_dist = total_logp[cluster]
    cluster_count = total_count[cluster]

    sel_col.setValueFromString(r, "Selected")
    count_col.setValueFromString(r, str(cluster_count))
    avg_dist_col.setValueFromString(r, str(cluster_dist / float(cluster_count)))

    avg_logp_col.setValueFromString(r, str(logp_dist / float(cluster_count)))
Chose lowest LogP within a cluster
Rather than simply choose the centroid this script “ChoseLowestLogPFromClusters.vpy” selects the molecule with the lowest LogP, again this script could be modified to use and property within the workspace, simply edit the code to generate the dialog box shown below. This is a modification of the chosecentroid script and shows how any property can be used to select from clusters.
input_label = swing.JLabel("Select LogP column")
input_cb = workspace.getColumnComboBox()
panel = swing.JPanel()

layout.fill(panel, input_label, 0, 0)
layout.fill(panel, input_cb,    1, 0)

ret = vortex.showInDialog(panel, "Choose LogP column")

if ret == vortex.OK:
    input_idx = input_cb.getSelectedIndex()

    if input_idx == 0:
        vortex.alert("you must choose a column")
    else:
        colscore = vtable.getColumn(input_idx - 1)
Choose a list of clusters
Rather than selecting a molecule from each cluster you might to select a range of cluster, perhaps based on the Average LogP of the Cluster. This script “SelectaListClusters” allows the user to select a defined list of clusters. It requires as input a plain text file containing cluster numbers.
Generic Category Analysis
The cluster analysis script is a specific use of this more generic script, this can be used to analyse any categorical information. Simply choose the category column and the script creates a new workspace with two columns, the first contains each of the categories the second the number of occurrences.
The scripts can be downloaded her
Last updated 14 December 2020